™
Page 35 of 65
4 Using the vLoc3-DM Receiver
The A-Frame can be used in two configurations:
Standard Mode
((with the low-frequency sensor foot on): This is used to pinpoint or survey a pipeline section by undertaking an
ACVG survey (Alternating Current Voltage Gradient). The ACVG and Current gradient survey can be gathered at the same time.
See further explanation in the following section.
Simultaneous/Standard mode can be selected in the User Menu.
Simultaneous mode
(with the low-frequency sensor foot on): As standard mode with the addition of DM current measurements
and ACVG measurements are shown and logged simultaneously. See further explanation in the following section.
Simultaneous/Standard mode can be selected in the User Menu.
4.11.1
Fault Finding Method
Connect the transmitter as previously described. Select either 3Hz/6Hz/98Hz (ELF1) or 3Hz/6Hz/128Hz (ELF2) depending on
the mains frequency as previously described.
Using the A-frame
If the approximate position of a defect has been identified by the vLoc3-DM using the current gradient technique, start an A-frame
survey approximately 20 meters before this point. Place the A-frame on the ground so that the spikes puncture the ground, and
with the A-frame in line and over the pipe the green spike pointing toward the suspected fault.
Use the locate section of the screen to position the A-frame above the pipe.
The signal strength will be displayed and if the signal is strong enough an arrow will point forward. Press the “+” pushbutton to
save the reading. This will enter the result into the graph. The scaling of the graph is automated and may change as points are
added. Only the last 20 records will be shown on the screen. If you need to review other points press the Enter key, which will
take you to the review screen where all points can be reviewed.
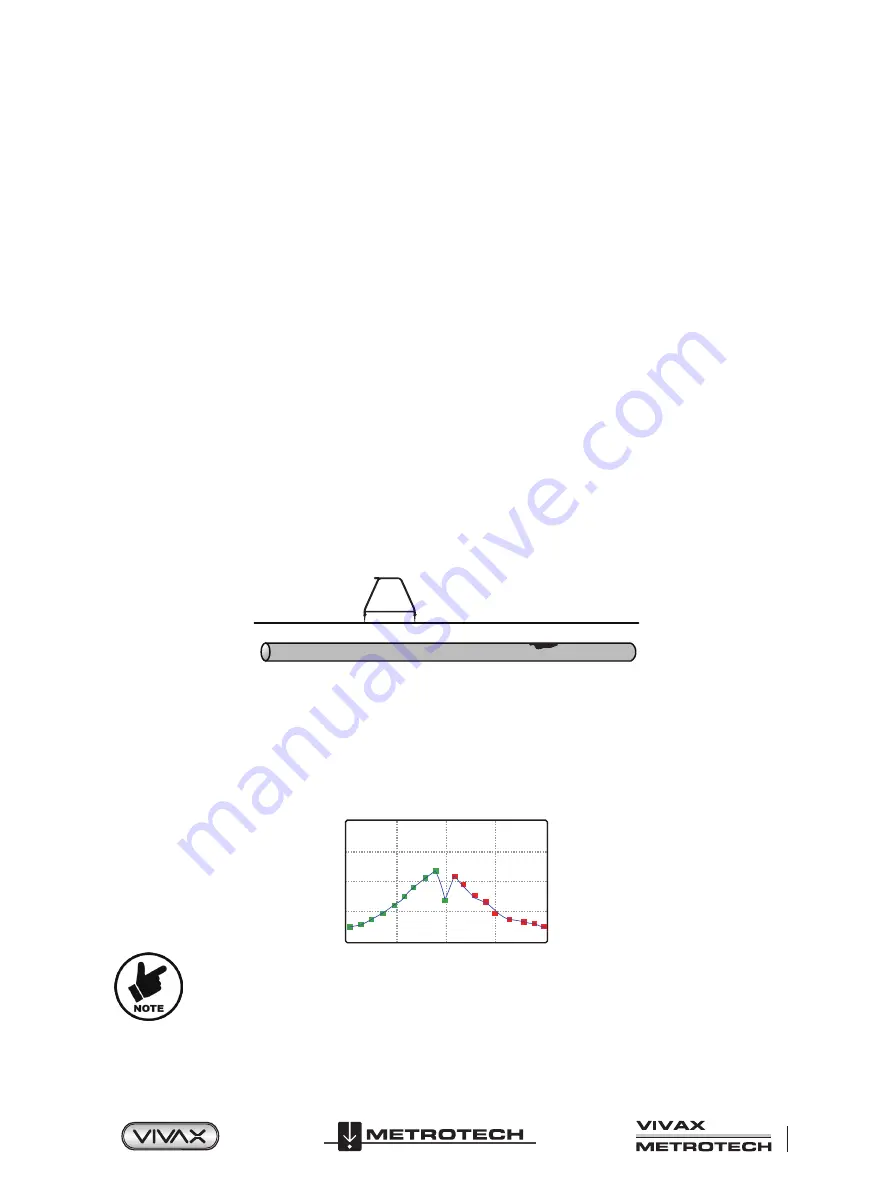
A-frame
Defect
Note that the receiver is not shown to simplify the diagrams. In all diagrams, the vLoc3-DM receiver would be
connected.
Continue walking in the arrow direction placing the A-frame in the ground at approximately one-meter intervals saving the results
as you go. The graph will rise as the defect is approached and then fall at the defect. Continuing past the defect will create a
similar but reversed effect. A typical defect signature is shown below.
Note that the graph's points will change depending on the fault direction indicated, i.e., green for forward and red for backward.
If GPS is not activated the horizontal intervals are assumed to be equal. If a GPS option is activated
the intervals are still shown equally on the graph, but the internal data log stores the GPS coordinates
with the GPS data. This is because the GPS function's accuracy tends to be less accurate than
required for A-frame fault finding.
To delete the log proceed as previously described in “Deleting the log.”


