UIT2400 INSTRUMENTATION MANUAL REV A, May 2020
9 OF 18
with a chart containing a bar or line graph. (see 15I & 15J to make changes to the chart
settings). Wide sets the meter to landscape mode.
Cloak:
Cloak provides a black and white low intensity display setting to minimize light output
into the environment. This was designed to prevent light from the UIT2400 display being
included in the light level measurement. Cloak has a very large data capture button to allow
the user to easily capture and store a single reading in the dark
.
Cloak does not have the
feature buttons.
Before entering cloak use Meter Tall for settings (see 14 below). For example
go to meter tall, click on display units for light level, then hit the home button and select cloak.
Captured measurements are appended to the “single_sample_file”, in the format date/time,
instantaneous value.
Light Stack:
Light stack fills the majority of the display with a color indicator.
RED
is typically used to indicate an error-unacceptable level that does not meet the customer’s
requirements. For hazard measurements, this level could be when the light level recorded is
unsafe. In other cases the level can be used as a go/no go level indicating the risk of product
failures when
intensities
are too low or too high.
YELLOW is typically used as a warning stage indicating the range has changed and is
approaching the “Red” error indicator level.
GREEN
indicates the readings are in the desired range.
The light level display and buttons are much smaller in the Light stack to allow a greater
viewing area for the color indicators.
Note:
for error message “Light Stack is not configured” see section 15K for set up.
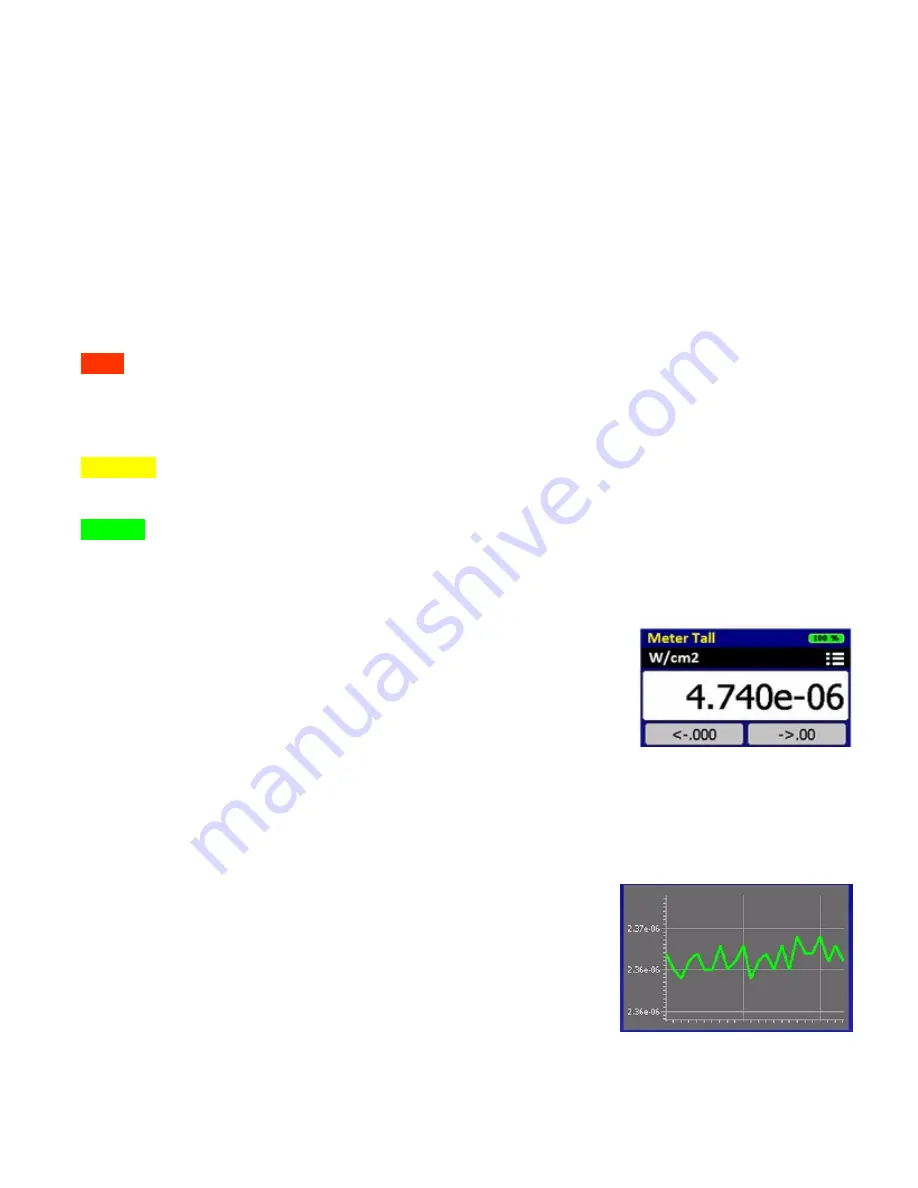
13. Display Content and Controls:
13A. Indicator Line:
Indicates which program is running, ie. Meter
Tall, and the battery life condition in percentage.
13B. Display Content:
The content note, located above the
display, indicates which display units have been selected by the
display units button, followed by the units of calibration and on the far right is the settings
access icon
.
13C. Resolution Adjustment:
The Left button
←
.000 increases the number of digits shown in
the numerical display the right button →.00 decreases the number of digits
.
13D. Display Graph:
In trend, the graph displays the average
light level since the last reading. The graph continues to update
even when Hold is pressed. Graph can be set to update as fast
as .1 seconds or as slow as once per hour.
Note: See
see 15I &
15J for setting bar or line graph.


