


15
Chapter 4: Status Tab
TOUGHSwitch
™
PoE User Guide
Ubiquiti Networks, Inc.
RX Bytes/Data
Displays the amount of data received.
RX Bytes
displays the amount in the
Raw
format (actual
number of bytes).
RX Data
displays the amount in the
Formatted
format – up to three decimal places in one of
these units of measurement: megabytes (MB), kilobytes
(kB), gigabytes (GB), or terabytes (TB).
RX Packets
Displays the number of packets received
without errors.
RX Errors
Displays the number of packets received with
errors.
TX Bytes/Data
Displays the amount of data transmitted.
TX Bytes
displays the amount in the
Raw
format (actual
number of bytes).
TX Data
displays the amount in
the
Formatted
format – up to three decimal places in
one of these units of measurement: megabytes (MB),
kilobytes (kB), gigabytes (GB), or terabytes (TB).
TX Packets
Displays the number of packets transmitted
without errors.
TX Errors
Displays the number of packets transmitted
with errors.
Reset Statistics
Click this button to clear the displayed
statistics and reset them to zero.
Total Throughput
By default,
Total Throughput
and
Data Distribution
are
displayed.
Total Throughput
displays the current data traffic on the
TOUGHSwitch in both graphical and numerical form. The
chart scale and throughput dimension (bps, kbps, Mbps)
change dynamically depending on the mean throughput
value. The statistics are updated automatically.
Data Distribution
Two pie charts,
RX
and
TX
, display the data traffic allocated
among the ports of the TOUGHSwitch. The pie charts are
updated automatically.
All/Last 20 sec
By default, the pie charts are displayed in
All
format, which is cumulative over time. To display data
distribution for the last 20 seconds, click
Last 20 sec
.
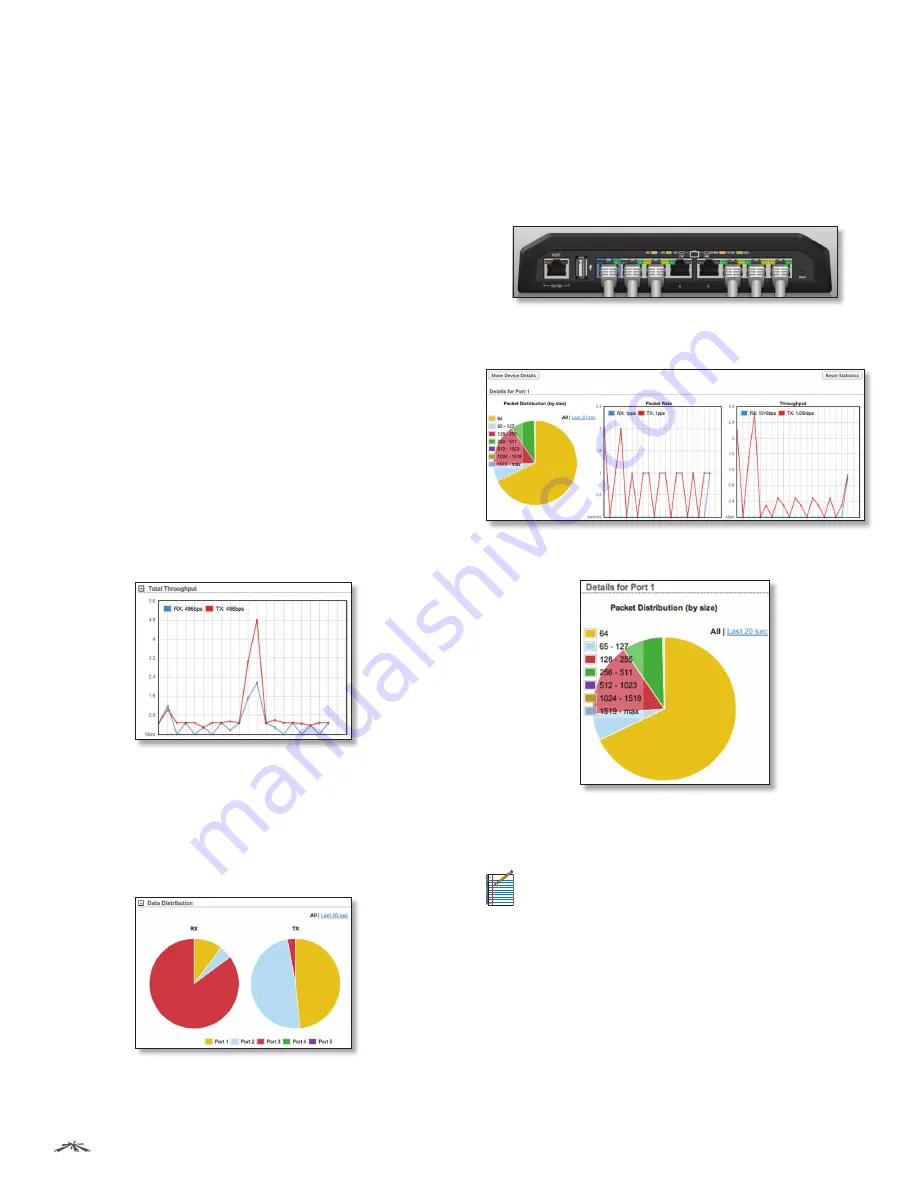
Details for Port
To display
Packet Distribution
,
Packet Rate
, and
Throughput
for a specific port, click the port on the image. The
selected port is highlighted in blue.
To return to the default view displaying
Total Throughput
and
Data Distribution
, click
Show Device Details
.
Packet Distribution
A pie chart,
Packet Distribution,
displays the current packet
sizes going through the port. The pie chart is updated
automatically.
Note:
The TOUGHSwitch PoE PRO does not display
Packet Distribution
.
All/Last 20 sec
By default, the pie chart is displayed in
All
format, which is cumulative over time. To display packet
distribution for the last 20 seconds, click
Last 20 sec
.


