This is in contrast to the cell counts in brightfield, where the counting algorithm assumes a 1:1 dilution
of the sample in trypan blue and displays the original cell concentration (i.e., before the dilution) in the
Results
screen.
Identify objects counted
Identify cells counted in fluorescence assays
1.
On the
Results
screen, select the appropriate icon/s to turn on or off the layer/s viewed.
For example, select
.
2.
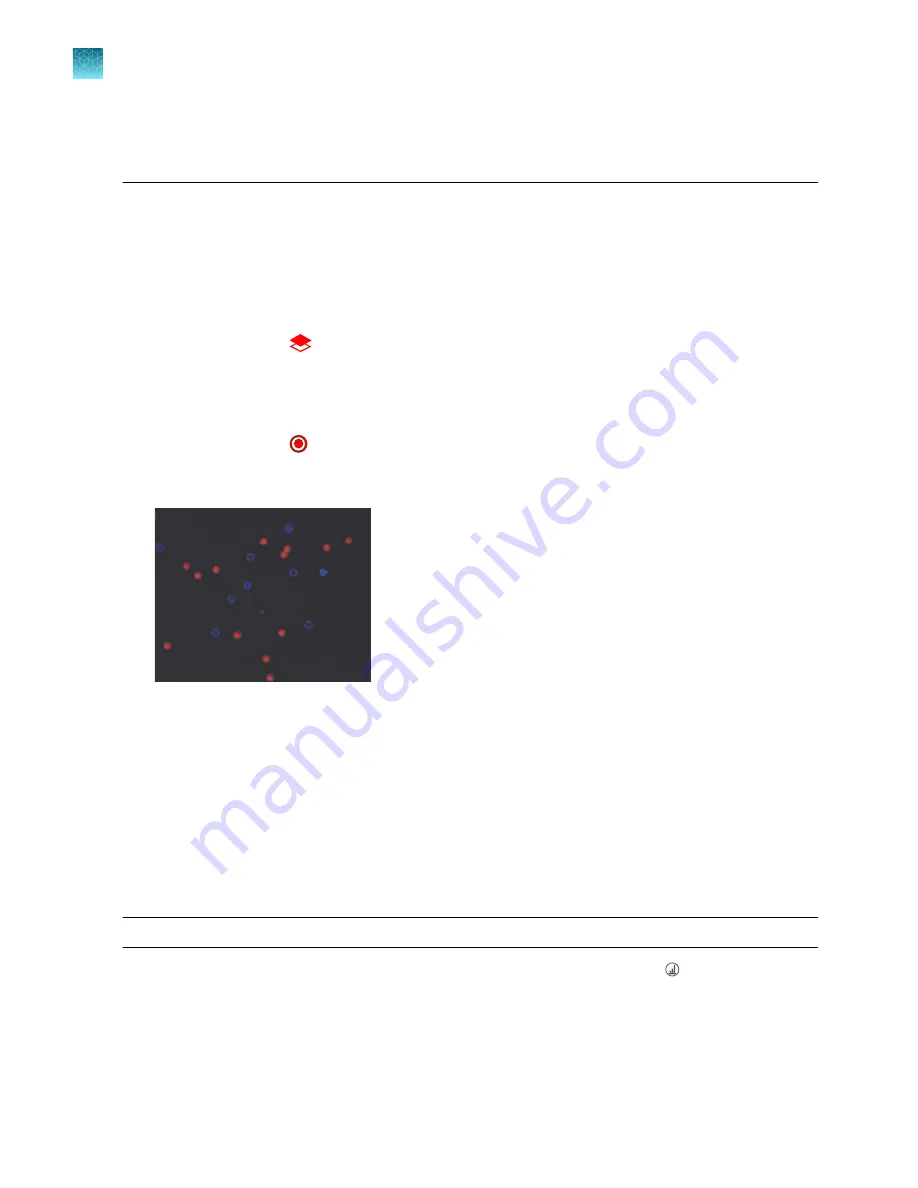
To identify the cells that are counted in a specific channel, press the corresponding contours icon.
Cells counted in the selected channel will be circled on the screen with the same color as the
selected channel.
For example, select .
In the example below, both the DAPI and TX Red boundary buttons are selected, and the cells
counted in the DAPI and TX Red channels are marked with blue and red circles, respectively.
3.
To unmark the cells counted in a specific channel, press the corresponding boundaries button
again.
Histogram count results
View histogram for cell fluorescence assays
For fluorescence assays, you have the option of viewing the distribution of the cells based on size or
based on relative fluorescence intensity in a graphical format.
Note:
You can view the histogram on the
Results
and
Gating
screens.
1.
To view the histogram showing the distribution of cells based on size, press
Histogram
and
then select
BF
(brightfield).
The histogram displays the size distribution of the total cell count (number of cells vs. cell size in
µm) and the average size of the cells counted in each available fluorescence channel.
Chapter 6
Fluorescence assays
Identify objects counted
6
34
Countess
™
3 FL Automated Cell Counter User Guide
Содержание AMQAF2000
Страница 73: ......