28 Getting Started with TI InterActive!
TII_GettingStarted.doc Getting Started with TI InterActive! Karen Davis Revised: 6/15/04 2:00 PM Printed: 6/15/04 3:39 PM Page 28 of 63
1. At the left side of the formatting toolbar, click the down
arrow
next to the font name, and click Arial as the font for
the assignment title.
2. Click the down arrow
next to the text size and click
24
as
the text size for the title.
3. Type the three title lines shown at the top of the sample on
the previous page. Press the Enter key on the computer
keyboard after each line.
4. Press Enter again to leave a blank line after the title.
1. Click the down arrow
next to the text size and click
10
as
the size for the document’s normal text.
2. Type
Here’s a graph of the function y=sin(x):
and press Enter
on the computer keyboard.
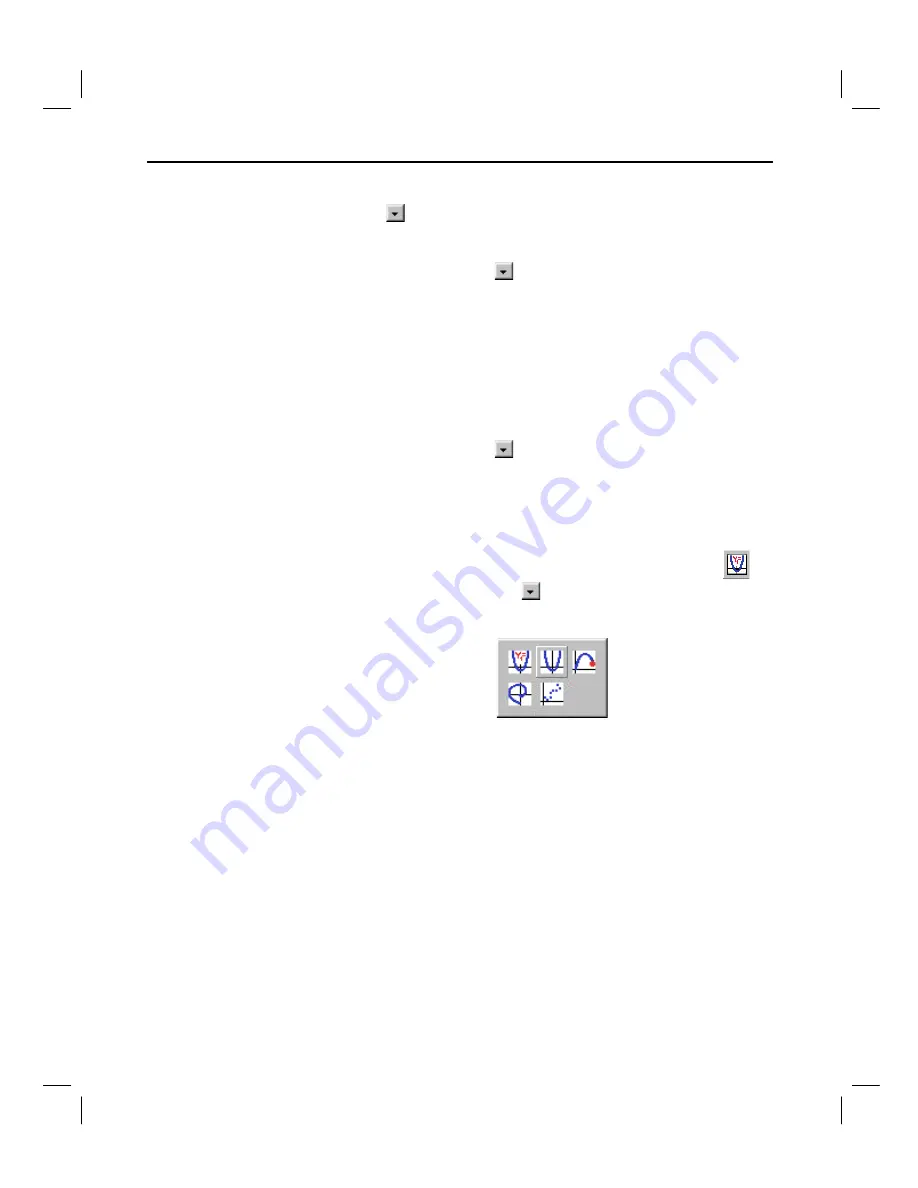
3. On the TI InterActive! toolbar, locate the Graph button
and click the down arrow
next to it. A group of buttons is
displayed, representing the available graph types.
Creating a title
for the
assignment
Inserting and
defining a graph
TIP
: The Graph button’s
toolbar image reflects
the most recently used
graph type. To create a
new graph of that type,
just click the button
instead of the down
arrow.


