background image

Triggering

CSA7000 Series, TDS7000 Series, & TDS6000 Series Instruments User Manual

3- 101

Overview

Control elements and resources

Trigger based on pulse width (Cont.)

To set mode

and holdoff

8.

Mode and holdoff can be set for all standard trigger
types.

See

To set holdoff

on page 3--84 and

To select the

trigger mode

on page 3--81 for mode and holdoff

setup. To learn more about trigger mode and

holdoff, see

Trigger Modes

on page 3--74 and

Trigger Holdoff

on page 3--75.

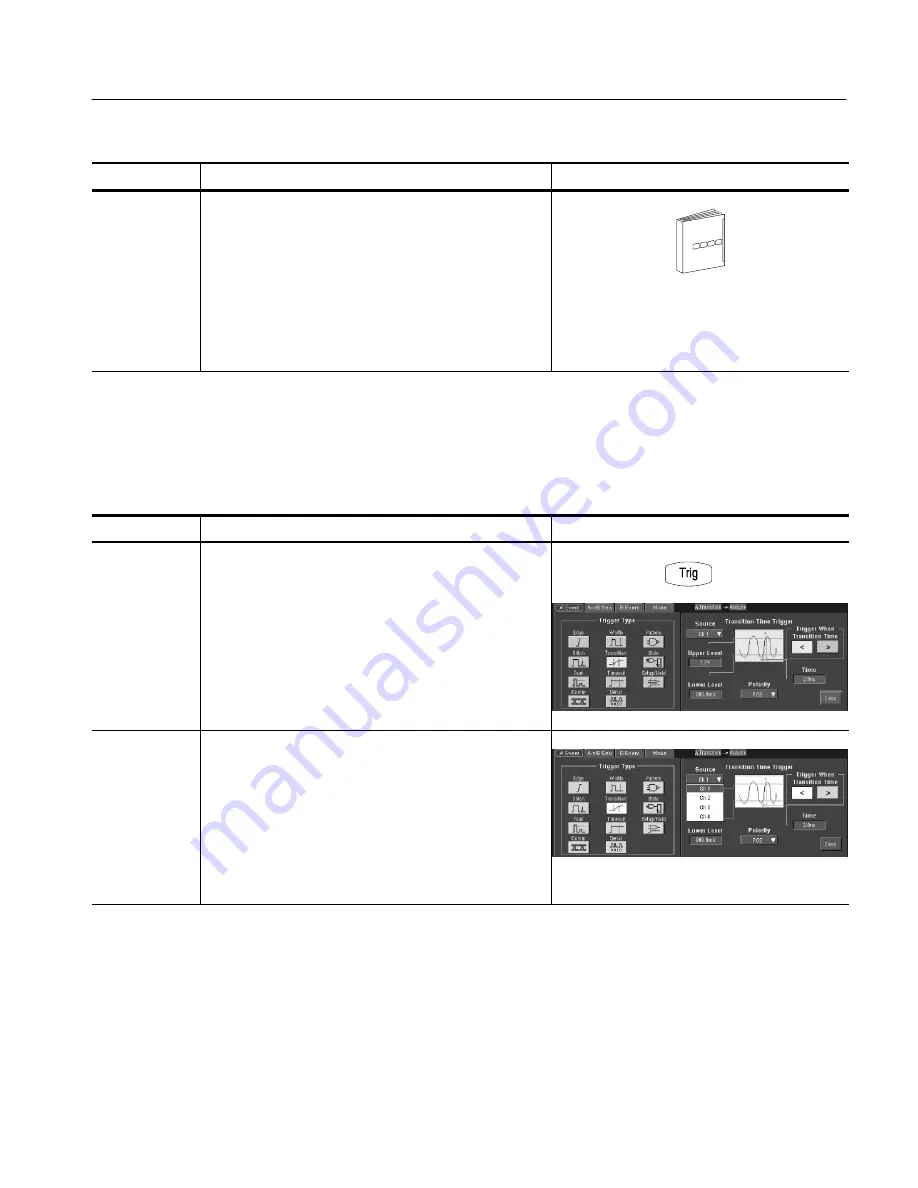
When you select the type Transition Time (slew rate), the instrument will trigger
on a pulse edge that traverses between an upper and lower threshold faster or
slower than a transition time you specify. To set up for transition time triggering,
do the following procedures.

Overview

To trigger based on transition time

Control elements and resources

Select transition

triggering

1.

From the toolbar, touch Trig, and select the A Event tab
of the Trigger control window.

2.

Touch Transition.

Select the

source

3.

To specify which channel becomes the trigger source,
touch Source, and select the source from the list.

To Trigger Based

on Transition Time

Содержание CSA7154

Страница 1: ...254 TDS7154 TDS7104 TDS7054 Digital Phosphor Oscilloscopes TDS6604 TDS6404 Digital Storage Oscilloscopes 071 7010 02 This document supports firmware version 2 3 0 and above www tektronix com Advanced Test Equipment Rentals www atecorp com 800 404 ATEC 2832 Established 1981 ...

Страница 2: ...mation in this publication supercedes that in all previously published material Specifications and price change privileges reserved Tektronix Inc P O Box 500 Beaverton OR 97077 0001 TEKTRONIX and TEK are registered trademarks of Tektronix Inc TekConnect TekVISA FastFrame and VocalLink are registered trademarks of Tektronix Inc ...

Страница 3: ...eturn of the product to Customer Customer shall be responsible for paying any associated taxes or duties This warranty shall not apply to any defect failure or damage caused by improper use or improper or inadequate maintenance and care Tektronix shall not be obligated to furnish service under this warranty a to repair damage resulting from attempts by personnel other than Tektronix representative...

Страница 4: ......

Страница 5: ...ent Requirements 1 7 Connecting Peripherals 1 7 Powering On the Instrument 1 9 Shutting Down the Instrument 1 10 Creating an Emergency Startup Disk 1 11 Backing Up User Files 1 11 Installing Software 1 12 Enabling Your LAN and Connecting to a Network 1 15 Setting up a Dual Display 1 17 Incoming Inspection 1 21 Assemble Equipment 1 21 Self Tests 1 22 Functional Tests 1 23 Check Vertical Operation 1...

Страница 6: ... 3 8 Connecting and Conditioning Your Signals 3 10 To Set Up Signal Input 3 13 To Autoset the Instrument 3 17 To Reset the Instrument 3 18 To Get More Help 3 19 Input Conditioning Background 3 19 Setting Acquisition Controls 3 26 Using the Acquisition Controls 3 28 To Set Acquisition Modes 3 34 To Start and Stop Acquisition 3 37 To Set Roll Mode 3 38 Acquisition Control Background 3 39 Acquisition...

Страница 7: ...al Bandwidth 3 68 Bandwidth for Unfiltered Settings 3 70 Bandwidth for Reference Receiver settings 3 70 Triggering 3 71 Triggering Concepts 3 72 The Trigger Event 3 73 Trigger Sources 3 73 Trigger Types 3 73 Trigger Modes 3 74 Trigger Holdoff 3 75 Trigger Coupling 3 76 Horizontal Position 3 77 Slope and Level 3 77 Delayed Trigger System 3 78 Triggering from the Front Panel 3 78 Access Procedures 3...

Страница 8: ...eforms 3 147 Taking Automatic Measurements 3 148 Using Automatic Measurements 3 150 To Take Automatic Measurements 3 153 To Localize a Measurement 3 159 Taking Cursor Measurements 3 160 Using Cursors 3 162 To Set the Cursor Sources 3 165 Taking Histograms 3 168 Using Histograms 3 169 To Start and Reset Histogram Counting 3 169 Histogram Measurements 3 171 Optimizing Measurement Accuracy 3 171 To C...

Страница 9: ...xporting and Copying Waveforms 3 262 To Export Your Waveform 3 263 To Use an Exported Waveform 3 271 To Copy Your Waveform 3 273 Printing Waveforms 3 277 To Print from Front Panel 3 277 To Print from Menu Bar 3 277 To Set Up the Page 3 278 To Preview the Page 3 279 To Print Using Print Screen 3 280 To Date Time Stamp Hardcopies 3 281 Remote Communication 3 282 Accessing Online Help 3 283 How to Us...

Страница 10: ...s B 8 Measurements Annotations B 9 Appendix C Menu Bar Commands C 1 File Commands C 1 Edit Commands C 3 Vertical Commands C 4 Horizontal and Acquisition Commands C 5 Trigger Commands C 7 Display Commands C 9 Cursors Commands C 11 Measure Commands C 11 Masks Commands C 13 Math Commands C 14 Utilities Commands C 15 Help Commands C 16 Appendix D Cleaning D 1 Exterior Cleaning D 1 Flat Panel Display C...

Страница 11: ... for trigger test 1 31 Figure 1 11 Setup for the file system test 1 33 Figure 3 1 Input and Acquisition Systems and Controls 3 9 Figure 3 2 Setting vertical range and position of input channels 3 22 Figure 3 3 Varying offset moves the vertical acquisition window on the waveform 3 23 Figure 3 4 Horizontal Acquisition window definition 3 24 Figure 3 5 Common trigger record length and acquisition rat...

Страница 12: ...gure 3 25 Example advanced trigger readout 3 89 Figure 3 26 Violation zones for Setup Hold triggering 3 93 Figure 3 27 Triggering on a Setup Hold time violation 3 113 Figure 3 28 Triggering with Horizontal Delay off 3 115 Figure 3 29 Triggering with Horizontal Delay on 3 116 Figure 3 30 Trigger and Horizontal Delay summary 3 117 Figure 3 31 Display elements 3 124 Figure 3 32 Horizontal Position in...

Страница 13: ...threshold 3 213 Figure 3 51 Windowing the time domain record 3 215 Figure 3 52 Example of scallop loss for a Hanning window without zero fill 3 217 Figure 3 53 Time and frequency graphs for the Gaussian window 3 219 Figure 3 54 Time and frequency domain graphs for the Rectangular window 3 220 Figure 3 55 Time and frequency graphs of the Hamming window 3 221 Figure 3 56 Time and frequency graphs fo...

Страница 14: ...s Instruments User Manual Figure 3 63 Print window 3 277 Figure 3 64 Hardcopy formats 3 278 Figure 3 65 Page setup window 3 279 Figure 3 66 Print preview window 3 280 Figure B 1 Levels used to determine measurements B 5 Figure B 2 Eye diagram and optical values B 7 ...

Страница 15: ...laying waveforms 3 126 Table 3 7 Operations performed based on the waveform type 3 126 Table 3 8 Customizable display elements 3 138 Table 3 9 Cursor functions types 3 161 Table 3 10 Cursor units 3 165 Table 3 11 Math expressions and the math waveforms produced 3 188 Table 3 12 Spectral analyzer controls 3 203 Table 3 13 Window characteristics 3 216 Table A 1 Instrument models A 2 Table A 2 Channe...

Страница 16: ...Table B 2 Supported measurements and their definition B 9 Table C 1 File menu commands C 1 Table C 2 Edit menu commands C 3 Table C 3 Vertical menu commands C 4 Table C 4 Horiz Acq menu commands C 5 Table C 5 Trig menu commands C 7 Table C 6 Display menu commands C 9 Table C 7 Cursor menu commands C 11 Table C 8 Measure menu commands C 11 Table C 9 Masks menu commands C 13 Table C 10 Math menu com...

Страница 17: ...to earth ground Before making connections to the input or output terminals of the product ensure that the product is properly grounded Observe All Terminal Ratings To avoid fire or shock hazard observe all ratings and markings on the product Consult the product manual for further ratings information before making connections to the product Do Not Operate Without Covers Do not operate this product ...

Страница 18: ...to this product or other property Terms on the Product These terms may appear on the product DANGER indicates an injury hazard immediately accessible as you read the marking WARNING indicates an injury hazard not immediately accessible as you read the marking CAUTION indicates a hazard to property including the product Symbols on the Product The following symbols may appear on the product CAUTION ...

Страница 19: ...n incoming inspection procedure H Operating Basics uses maps to describe the various interfaces for controlling the instrument including the front panel and the software user interface These maps provide overviews of the product and its functions from several viewpoints H Reference comprises an encyclopedia of topics see Overview on page 3 1 that describe the instrument interface and features and ...

Страница 20: ...d in the instrument Reference A quick reference to major features of the instrument and how they operate Programmer Online Guide An alphabetical listing of the programming commands and other information related to controlling the instrument over the GPIB1 This document is available as both an online help program and as a PDF manual Service Manual Describes how to service the instrument to the modu...

Страница 21: ...e www tektronix com Sales support 1 800 833 9200 select option 1 Service support 1 800 833 9200 select option 2 Technical support Email techsupport tektronix com 1 800 833 9200 select option 3 6 00 a m 5 00 p m Pacific time This phone number is toll free in North America After office hours please leave a voice mail message Outside North America contact a Tektronix sales office or distributor see t...

Страница 22: ...Preface xviii CSA7000 Series TDS7000 Series TDS6000 Series Instruments User Manual ...

Страница 23: ...cedure for verifying basic operation and functionality H Accessories Options lists the standard and optional accessories for this product Models This manual supports the following instruments H CSA7404 Communications Signal Analyzer H CSA7154 Communications Signal Analyzer H TDS7404 Digital Phosphor Oscilloscope H TDS7254 Digital Phosphor Oscilloscope H TDS7154 Digital Phosphor Oscilloscope H TDS7...

Страница 24: ...00 000 acquisitions per second for analog instrument emulation and isolation of data dependent failures during conformance performance testing and for examination of very low level signals in pseudo random bit streams H CSA7000 Series Communication signal analysis serial mask testing serial pattern triggering and triggering on communications signals Use of these features is described in the Option...

Страница 25: ...scroll up to four zoom areas H An intuitive graphical user interface UI with online help that is built in and available on screen H Internal removable disk storage H Wide array of probing solutions Product Software The instrument includes the following software H System Software which includes a specially configured version of Windows 2000 comes preinstalled on the instrument Windows 2000 is the o...

Страница 26: ...at you need to program the instrument through its GPIB interface A printable PDF file of this information is also available on the compact disc H Performance Verification Procedures The compact disc contains instructions to perform a performance verification See the instructions for the compact discs for information about installing the support software Occasionally new versions of software for yo...

Страница 27: ... Powering On the Instrument on page 1 9 H Shutting Down the Instrument on page 1 10 H Creating an Emergency Startup Disk on page 1 11 H Backing Up User Files on page 1 11 H Installing Software on page 1 12 H Enabling Your LAN and Connecting to a Network on page 1 15 H Setting up a Dual Display on page 1 17 CAUTION Be sure to create your emergency startup disk as described on page 1 11 You may need...

Страница 28: ...and additional support software that may be useful to you the Operating System Restore Product Software and Optional Applications Software Store the product software in a safe location where you can easily retrieve it NOTE The certificate of authenticity Windows 2000 licence agreement is attached to the rear of your instrument This certificate proves your ownership of the Windows operating system ...

Страница 29: ... provided by the instrument feet If you operate the instrument while it is resting on the rear feet make sure that you properly route any cables coming out of the rear of the instrument to avoid damaging them CAUTION To prevent damage to the instrument keep the bottom and sides of the instrument clear of obstructions for proper cooling The Specifications in Appendix A list the operating requiremen...

Страница 30: ...yboard to the instrument connectors You can connect and disconnect USB devices with the power on See Shutting Down the Instrument on page 1 10 Monitor PC only for dual display operation Printer RS 232 Network Keyboard Mouse USB Compact disk drive GPIB Instrument monitor large screen instrument display Card Slot Description Icon Label Locations Audio line out Audio line in Removable hard drive Figu...

Страница 31: ...ation Instructions for information on installing the rackmount kit Other Refer to the Readme file on the Product Software CD for possible additional accessory installation information not covered in this manual Powering On the Instrument Follow these steps to power on the instrument for the first time Either one of the following fuse sizes can be used each size requires a different fuse cap Both f...

Страница 32: ...n process including a Windows shutdown to preserve settings and then removes power from most circuitry in the instrument Avoid using the rear panel power switch or disconnecting the line cord to power off the instrument NOTE If you do not use the On Standby switch to shut down the instrument before powering off the instrument the instrument will be in the factory Default Setup when powered on the ...

Страница 33: ... and format the hard disk Follow these steps to create the emergency startup disk 1 Minimize the instrument application by selecting Minimize in the File menu 2 Click the Windows Start button point to Programs Accessories System Tools and click Backup 3 On the Tools menu click Create an Emergency Repair Disk 4 Insert a floppy disk into the disk drive and follow the on screen instructions to create...

Страница 34: ...le on the product soft ware CD before performing installation procedures This file contains additional installation and operation information that supercedes other product documenta tion To view the README TXT file open the Notepad Windows accessory Then open the file on the Product Software CD The Product Software CD also contains accessory software and files that you can choose to install in the...

Страница 35: ... You should not install this software on the oscilloscope but rather on the PC you plan to use as a GPIB controller The GPIB controller must be equipped with a National Instruments GPIB Controller card and software Manual Performance Verification Procedure This is a printable PDF file that describes how to verify the instrument performance using generic test equip ment User manual This is a PDF fi...

Страница 36: ...plication NOTE If you are not using a USB keyboard and mouse you must power on the instrument after attaching your keyboard and mouse 1 Connect a keyboard and mouse to the instrument 2 While holding down the CTRL and ALT keys press the DELETE key 3 Select Task Manager 4 In the Applications tab select TekScope exe and then select End Process to stop the instrument application The instrument applica...

Страница 37: ...ss and other communications functions Before you make the connection do the following steps to enable network access to the instrument Power down 1 Power on Rear panel Front panel 2 Connect a keyboard and mouse 3 Figure 1 3 Enabling your LAN and connecting to a network 4 As the instrument begins to boot press the F2 key on the keyboard repeatedly until the message Entering SETUP Loading SETUP on s...

Страница 38: ...ow up or down key to highlight Enabled and then press Enter 9 Press the F10 key to save and exit Confirm the Save of Configuration changes when you are prompted on screen 10 Use the Windows network setup utility to define the instrument as a network client and configure it for your network You can find the network setup utility in the Windows Start menu if you select Settings Control Panel and the...

Страница 39: ... steps to set up the instrument for dual display operation You can operate the instrument while having full use of Windows and other applica tions on the external monitor 1 2 3 4 5 Power on Connect a keyboard and mouse Connect an external monitor Use the On Standby switch to power down Power on Figure 1 4 Setting up a dual display ...

Страница 40: ... to enable the new monitor 12 Set the resolution that you want to use on the external monitor 13 Click on the external monitor in the display box and drag it to the correct orientation CAUTION Do not change the resolution or color settings for the internal LCD monitor The internal resolution must be 640 x 480 and the color setting must be High Color 24 bit 14 Click OK to apply the settings The new...

Страница 41: ...where you want it to be External monitor Drop Select all 3 Internal monitor Drag Figure 1 6 Moving Windows desktop icons to the external monitor 4 If you use the instrument help system you can drag the help windows to the external monitor so that you can read them while you operate the instrument 5 When you open any Windows application drag the windows from the application to the external monitor ...

Страница 42: ...Installation 1 20 CSA7000 Series TDS7000 Series TDS6000 Series Instruments User Manual ...

Страница 43: ...ed diagnostics If the instrument fails any test within this section it may need service To contact Tektronix for service see Contacting Tektronix on page xvii Make sure you have put the instrument into service as detailed in Installation starting on page 1 5 Then assemble the following test equipment and proceed with the procedures that follow Assemble Equipment Self tests do not require any test ...

Страница 44: ... substeps to verify passing of internal diagnostics a Display the System diagnostics menu H If the instrument is in tool bar mode click the MENU button to put the instrument into menu bar mode H From the Utilities menu select Instrument Diagnostics This displays the diagnostics control window b Run the System Diagnostics H First disconnect any input signals and probes from all four channels H Clic...

Страница 45: ...s Verify that the word Pass appears in the instrument calibration control window 2 Return to regular service Click the Close button to exit the instrument calibration control window Functional Tests The purpose of these procedures is to confirm that the instrument functions properly A list of required test equipment is shown on page 1 21 NOTE These procedures verify that the instrument features op...

Страница 46: ...will be highlighted If this is the case it is not necessary to push the button Equipment required One BNC cable CSA7404 CSA7154 TDS7404 TDS7254 TDS7154 TDS6604 TDS6404 One P7240 probe P7260 probe for TDS6604 One probe calibration and deskew fixture Prerequisites None 1 Initialize the instrument Push the front panel DEFAULT SETUP button 2 Hook up the signal source Connect the equipment as shown in ...

Страница 47: ...DS6404 Connect the probe tip to the short pin and the probe ground to the long pin as shown A BNC cable from PROBE COMPENSATION output to the A input of the Probe Calibration and Deskew Fixture Remove the jumper TDS7104 TDS7054 BNC cable from PROBE COMPENSATION output to channel input GAIN CAL connections TDS6604 BNC cable from the PROBE COMPENSATION output to the GAIN CAL SIG input on the fixture...

Страница 48: ...ng H Touch the Vert button and then touch Offset Confirm that the Ch1 Offset is 1 8 V 0 0 V if not using a probe 6 Verify that the channel is operational Confirm that the following statements are true H Verify that the vertical scale readout and the waveform amplitude for the channel under test are as shown in Table 1 3 Table 1 3 Vertical settings CSA7404 CSA7154 TDS7404 TDS7254 TDS7154 TDS6604 TD...

Страница 49: ...following statements are true see Using the Acquisition Controls on page 3 28 for more information H Sample mode displays an actively acquiring waveform on screen Note that there is a small amount of noise present on the square wave H Peak Detect mode displays an actively acquiring waveform on screen with the noise present in Sample mode peak detected H Hi Res mode displays an actively acquiring w...

Страница 50: ...04 BNC cable from PROBE COMPENSATION output to CH 1 input TDS7104 TDS7054 BNC cable from PROBE COMPENSATION output to CH 1 input Figure 1 9 Setup for time base test 3 Set up the instrument Push the front panel AUTOSET button 4 CSA7404 CSA7154 TDS7404 TDS7254 TDS7154 TDS6604 TDS6404 Touch the Vert button and then touch Offset Adjust the Ch1 Offset to 0 8 V using the multipurpose knob 5 CSA7404 CSA7...

Страница 51: ...ed 8 Verify horizontal delay a Center a rising edge on screen H Set the horizontal POSITION knob so that the rising edge where the waveform is triggered is lined up with the center horizontal graticule H Change the horizontal SCALE to 20 s div The rising edge of the waveform should remain near the center graticule and the falling edge should be off screen b Turn on and set horizontal delay H From ...

Страница 52: ...ould remain near the center graticule If not readjust the delay setting to center the falling edge H Push the front panel DELAY button several times to toggle delay off and on and back off again Verify that the display switches quickly between two different points in time the rising and falling edges of this signal 9 Remove the test hookup Disconnect the equipment from the channel input and the pr...

Страница 53: ...o 0 8 V using the multipurpose knob 5 CSA7404 CSA7154 TDS7404 TDS7254 TDS7154 TDS6604 TDS6404 Set the Vertical SCALE to 100 mV per division 6 Verify that the main trigger system operates Confirm that the following statements are true H The trigger level readout for the A main trigger system changes with the trigger LEVEL knob H The trigger LEVEL knob can trigger and untrigger the square wave signa...

Страница 54: ...ipurpose knob the square wave probe compensation signal can become triggered and untriggered Leave the signal triggered c Verify the delayed trigger counter H Double click the Trig Delay control to pop up a numeric keypad for that control H Click on the keypad to enter a trigger delay time of 1 second and then click Enter H Verify that the trigger READY indicator on the front panel flashes about o...

Страница 55: ...test 3 Insert the test disk Insert the floppy disk in the floppy disk drive at the top of the front panel 4 Set up the instrument Push the front panel AUTOSET button 5 CSA7404 CSA7154 TDS7404 TDS7254 TDS7154 TDS6604 TDS6404 Touch the Vert button and then touch Offset Adjust the Ch1 Offset to 0 8 V using the multipurpose knob 6 CSA7404 CSA7154 TDS7404 TDS7254 TDS7154 TDS6604 TDS6404 Set the Vertica...

Страница 56: ...file system works a Click the Recall Setups tab in the control window b Click the Recall button under Recall settings from file in the control window This displays a familiar Windows dialog box for locating the settings file that you want to recall c In the Recall Instrument Setup dialog box select the 31 2 Floppy A icon in the Look in drop down list d Locate and double click in the dialog box on ...

Страница 57: ... pages To check the hardware and Windows software underlying the instrument UI user interface run the CheckIt Utilities from the Windows Start menu 1 Exit the instrument application before running the external diagnostics a Display the Task Manager by pressing CTRL ALT and Delete and then touch Task Manager b Select TekScope and then touch End Task 2 Click Start then click Programs in the Start Me...

Страница 58: ...Incoming Inspection 1 36 CSA7000 Series TDS7000 Series TDS6000 Series Instruments User Manual ...

Страница 59: ...s for converting to rackmount configuration n n n n n n n n n Acquisition memory 2M Long record length 2 Ms per channel 8 Ms maximum n n n n n n n 3M Long record length 4 Ms per channel 16 Ms maximum n n n n n n n 4M Long record length 8 M per channel 32 Ms maximum n n n n n Probes 30 No probes n n 33 Add one P6158 3 GHz low capacitance 20x divider probe n n 34 Add one P6247 1 GHz differential pro...

Страница 60: ...d Jitter Analysis application with random and deterministic jitter analysis n n n n n n n n n CP2 TDSCPM2 Compliance Testing for ITU T G 703 and ANSI T1 102 communications standards Requires Option SM n n n n n n n USB USB2 Compliance Testing Software for USB1 0 USB2 0 standards requires TDSUSBF USB test fixture n n n n n n n n n SM Serial Communications Mask Testing Standard on CSA7000 Series n n...

Страница 61: ...ervices in Opt C3 n n n n n n n n n D5 Test Data for calibration services in Opt C5 n n n n n n n n n R3 Repair warranty extended to cover three years n n n n n n n n n R5 Repair warranty extended to cover five years n n n n n n n n n Accessories This section lists the standard and optional accessories available for this instrument The following accessories are shipped with the instrument Table 1 ...

Страница 62: ... Manual 071 1035 xx Online Help part of the application software Performance Verification a pdf file on the Product Software CD Programmer Online Guide files on the Product Software CD NIST Z540 1 and ISO9000 Calibration Certificate Four TekConnect to SMA adapters CSA7404 TDS7404 TDS6604 TDS6404 TCA SMA Four TekConnect to BNC adapters CSA7154 TDS7254 TDS7154 TCA BNC Adapters CSA7404 CSA7154 020 24...

Страница 63: ...ssories in Table 1 6 are orderable for use with the instrument at the time this manual was originally published Consult a current Tektronix catalog for additions changes and details Table 1 6 Optional accessories Accessory Part number Service Manual CSA7404 CSA7154 TDS7404 TDS7254 TDS7154 TDS7104 TDS7054 TDS6604 TDS6404 071 7011 xx 071 0711 xx 071 7021 xx Transit Case 016 1522 xx Scope Cart K4000 ...

Страница 64: ...5 P5210 high voltage differential probe1 P5210 P6015A high voltage probe1 P6015A ADA400A differential preamplifier1 ADA400A CT6 high frequency current probe1 CT6 AM503S DC AC current measurement system1 AM503S P7260 6 GHz 5X 25X active probe CSA7404 CSA7154 TDS7404 TDS7254 TDS7154 TDS6604 TDS6404 P7260 P6150 9 GHz 3 GHz low capacitance divider probe1 P6150 P6701B optical electrical converter 500 t...

Страница 65: ...ed Software VCLNKP VocalLink Basic Voice Controlled Software VCLNKB Wavewriter AWG and waveform creation software S3FT400 WSTRO WaveStar Software WSTRO GPIB cable 1 m 012 0991 01 GPIB cable 2 m 012 0991 00 RS 232 cable 012 1298 xx PS 2 keyboard 118 9402 00 USB Keyboard 119 6633 xx Centronics cable 012 1214 xx Replacement hard disk 650 4271 xx Optical Connector Adapters CSA7404 CSA7154 Optical Conn...

Страница 66: ...ents User Manual Table 1 6 Optional accessories Cont Accessory Part number Dust cap optical CSA7404 CSA7154 200 4104 00 1 Requires TCA BNC TekConnect BNC adapter on CSA7404 CSA7154 TDS7404 TDS7254 TDS7154 TDS6604 TDS6404 NOTE The P6339A probe is not supported by this instrument ...

Страница 67: ...scribes the elements of the User Interface UI application which provides complete control of the instru ment H Front Panel Map on page 2 8 describes the elements of the instrument front panel and cross references information relevant to each element H Display Map on page 2 9 describes elements and operation of single grati cule and multiple graticule displays H Front Panel I O Map on page 2 10 des...

Страница 68: ...res For more usage information see Online Help System below In Depth Operation and UI Help Online Help System Access online help from the instrument for context sensitive information on virtually all controls and elements on screen Online help includes procedures for using instrument functions See Accessing Online Help on page 3 283 NR3 Space GPIB Commands Online Programmers Guide Quickly find the...

Страница 69: ...eries TDS7000 Series TDS6000 Series Instruments User Manual 2 3 You may also want to obtain the optional service manual for this product if you self service or performance test this instrument See Accessories Options on page 1 37 ...

Страница 70: ...20 page 3 26 pages 3 147 3 185 pages 3 124 3 185 Trigger system page 3 71 Ref 1 4 Display UI Signal Processing Transformation Page 3 123 Optical to electrical converter CSA7000 Series Optical input Electrical output Recovered clock output Recovered data output The model comprises four high level subsystems or processes embodying a variety of hardware and software functions and the data that connec...

Страница 71: ...trigger events generated from the Trigger system H Acquisition System Performs the actual A D conversion and storing of digital samples H Optical to Electrical Converter CSA7000 Series Converts optical signals to electrical signals H DSP Transformation System Performs a variety of transformations or operations beginning with the most fundamental data element s in the system the Channel Waveform s ...

Страница 72: ...ping the pretrigger points current until triggering criteria are met or a trigger is forced Auto trigger mode only and the instrument accepts a trigger Acquire posttrigger points 5 The instrument acquires samples until the posttrigger portion of the waveform record channel being acquired is filled Waveform record complete No Yes 6 If averaging enveloping or waveform database is on the record becom...

Страница 73: ...rsors Readouts Display cursor readouts and measurement readouts in this area selectable from the menu bar or tool bar If a control menu is displayed these readouts move to the graticule area Controls Status Quick reference to vertical horizontal and trigger selections scale and parameters Multipurpose Knob Readouts Adjust parameters controlled by multipurpose knobs Buttons Menu Touch to toggle bet...

Страница 74: ...y scale or position the waveform Change the input termination TDS7104 TDS7054 Page 3 8 Horizontally scale position delay and set record length resolution of selected waveform Page 3 23 Turn knob to adjust waveform intensity Page 3 53 Push to turn cursors on or off Page 3 160 Turn the multipurpose knobs to adjust parameters selected from the screen interface Push a Fine button to toggle between nor...

Страница 75: ...tion icons to reposition a waveform Drag across the waveform area to zoom the boxed waveform segment Also enable disable histograms and measurement gating Drag cursors to measure waveforms on screen Click icon to assign multipurpose knobs to waveform vertical position and scale Drag icon to change the trigger level ...

Страница 76: ...round terminal Channel inputs Auxiliary trigger input Auxiliary trigger output CH 3 SIGNAL OUTPUT scale and offset controlled by CH3 controls Probe compensation output Ground terminal Channel inputs TDS7404 TDS7254 TDS7154 TDS6604 TDS6404 Floppy disk drive Recovered clock output Optical input O E converter electrical output Probe compensation output Ground terminal Channel inputs Recovered data ou...

Страница 77: ... instrument display PS 2 connectors for mouse and keyboard Parallel port Centronics to connect printer or other device GPIB port to connect to controller PCMCIA slots for two type 1 cards two type 2 cards or one type 3 card CDROM RW drive accessible from Windows Press to open Connectors for speaker and microphone CSA7000 Series Auxiliary external trigger input Auxiliary trigger output signal Analo...

Страница 78: ...Rear Panel I O Map 2 12 CSA7000 Series TDS7000 Series TDS6000 Series Instruments User Manual ...

Страница 79: ...section in this chapter provides background information needed to operate your instrument effectively as well as the higher level procedures for accessing and using the features These procedures emphasize using the front panel when possible H Lower level detailed usage procedures are in the online help system The table that follows on page 3 2 lists operating tasks and the sections in this chapter...

Страница 80: ...e 3 26 To Set Acquisition Modes Set up of the acquisition system 3 34 To Start and Stop Acquisition Starting and stopping acquisitions 3 37 To Set Roll Mode Setting up roll mode 3 38 Acquisition Control Background Background information on acquisition controls 3 39 Using Fast Acquisition Mode Overview and setup of Fast Acquisition mode 3 47 To Turn Fast Acquisitions On and Off Turning fast acquisi...

Страница 81: ...4 To Trigger on a Runt Pulse Setting up runt pulse triggering 3 96 Trigger Based on Pulse Width Setting up pulse width triggering 3 99 To Trigger Based on Transition Time Setting up transition time triggering 3 101 Trigger Based on Pulse Timeout Setting up pulse timeout triggering 3 104 Trigger on a Pattern Setting up pattern triggering 3 105 To Trigger on a State Setting up state triggering 3 109...

Страница 82: ... and Waveforms Overview of graticule and waveform adjustments you can make 3 144 Data Processing C l l ti Taking Measurements Measuring Waveforms Setup for measuring parameters 3 147 Calculation Taking Automatic Measurements Overview and setup for taking automatic measurements 3 148 To Take Automatic Measurements Set for automatic measurements 3 153 To Localize a Measurement Setup to measure a seg...

Страница 83: ... Overview of performing math operation on waveforms 3 186 ASin ACos ATan Sinh Cosh Tanh Average Invert Sqrt Log 10 Log e Exp Magnitude Real To Define a Math Waveform Defining math waveforms 3 194 Exp Magnitude Real Phase and Imag Operations on Math Waveforms Overview of measuring and adjusting math waveforms 3 197 To Use Math Waveforms Example setups for measuring and adjusting math waveforms 3 19...

Страница 84: ...veform Saving a waveform 3 254 To Recall Your Waveform Recalling a saved waveform 3 257 To Clear References Setup to clear references 3 260 Exporting and Copying Waveforms Background and setup for exporting waveforms and using exported waveforms 3 262 To Export Your Waveform Exporting a waveform to a file 3 263 To Use an Exported Waveform Using an exported waveform in Excel 3 271 To Copy Your Wave...

Страница 85: ...hannels and timebase for acquiring waveforms H Setting Acquisition Controls How to choose the appropriate acquisition mode for acquiring your waveforms how to start and stop acquisition H Acquisition Control Background Background information on the data sampling and acquisition process H Using Fast Acquisition Mode CSA7000 Series TDS7000 Series Using Fast Acquisition mode to capture and display tr...

Страница 86: ...derived waveforms math waveforms reference waveforms and so on The sections that follow cover display related usage H Displaying Waveforms on page 3 123 H Creating and Using Math Waveforms on page 3 185 Signal Connection and Conditioning This section presents overviews of the instrument features related to setting up the input signal for digitizing and acquisition It addresses the following topics...

Страница 87: ...pling Input termination Vertical scale Vertical position To the remainder of the acquisition Bandwidth limit Scale K1 K2 K3 External attenuation 50 Ω Probe K1 K2 K3 CSA7000 Series TDS7404 TDS7254 TDS7154 TDS6604 TDS6404 TDS7104 TDS7054 Figure 3 1 Input and Acquisition Systems and Controls Use input conditioning to ensure the instrument acquires the data that you want to display measure or otherwis...

Страница 88: ... Voltage offset is incompatible with reference waveforms because offset is an acquisition control Read the following topics related to waveform acquisition they provide details that can make it easier to set up and acquire your waveforms Probes and Signal Connection Select the probe or cable that brings the signal into the instrument Choose the probe or cable that best fits your acquisition task w...

Страница 89: ... coupling AC coupling and GND coupling The input resistance of each input channel is either 50 Ω or you can select 50 Ω or 1 MΩ depending on the model To properly terminate signals in other impedance environments use an adapter All probes expect a specific coupling and input termination Both coupling and input termination resistance are displayed on screen Scaling and Positioning These key control...

Страница 90: ... or maximum boundaries of the vertical acquisition window This limiting causes inaccuracies in amplitude related measurements Note that the acquisition window also includes 1 division above and below the displayed graticule area See Vertical Acquisition Window Considerations on page 3 20 Trigger and Display Set basic trigger controls to gate waveform acquisition and use the display to interactivel...

Страница 91: ...Prerequisites 1 The acquisition system should be set to run continuously See page 3 34 for acquisition setup and page 3 71 for trigger setup Connect input signal 2 Connect to the signal to be acquired using proper probing and connecting techniques Note For more details on control over input setup push the Vert button to display the Vertical control window and then touch the HELP button Select the ...

Страница 92: ...he probe requires Select input coupling 5 Touch Vert to display the Vertical control window To change the input coupling select the channel tab and then select from H DC to couple both the AC and DC components of an input signal H TDS7104 and TDS7054 AC to couple only the AC components of an input signal H GND to disconnect the input signal from the acquisition Touch Close to close the window Note...

Страница 93: ... input Cont Set vertical acquisition window 6 Use the vertical knobs to scale and position the waveform on screen Positioned vertically Scaled vertically 7 Touch Vert to display the Vertical control window To change the offset touch the Offset control and turn the multipurpose knob to adjust the offset Dragging the waveform handle also positions the waveform ...

Страница 94: ...d horizontally The Resolution knob sets the record length See discussion on page 3 24 If required to stabilize the display push LEVEL to set the trigger level to 50 Dragging the reference icon also positions the waveform For help 9 For more information on the controls described in this procedure push the Vert or Horiz button Touch the HELP button in the toolbar Continue with acquisition setup 10 T...

Страница 95: ...Push the Autoset button to execute an Autoset If you use Autoset when one or more channels are displayed the instrument selects the lowest numbered channel for horizontal scaling and triggering All channels in use are individually vertically scaled If you use Autoset when no channels are displayed the instrument turns on channel one CH 1 and scales it Execute Autoset Undo 3 The Autoset Undo contro...

Страница 96: ... Touch Close to save your prompt selection NOTE Autoset may change the vertical position to position the waveform appropriately It sets vertical offset to 0 V unless an offsetable probe is attached If you are not using an offsetable probe and your signal contains offset such as the probe compensation signal you may need to adjust the Vertical Offset and SCALE to display the signal You may want to ...

Страница 97: ...al controls from the online help Contents Index Find window select Contents and Index in the Help menu as shown at right This section contains background information that can help you more effectively set up the acquisition window of each channel Input This instrument samples in real time or random equivalent time both sampling systems provide pretrigger information by using the trigger to stop an...

Страница 98: ...ition controls manually Some conditions that can cause Autoset to fail are H No signal present H Signals with extreme or variable duty cycles H Signals with multiple or unstable signal periods H Signals with too low amplitude H No recognizable trigger signal H Signals with a frequency 20 Hz H Signals with a frequency above the bandwidth of the instrument H Signals with high offset and low peak to ...

Страница 99: ...o extend outside the vertical acquisition window the data acquired is clipped Clipped data causes inaccurate results if used in amplitude related automatic measurements Clipping also causes inaccurate amplitude values in waveforms that are stored or exported for use in other programs If the scale of a math waveform is changed so that the math waveform is clipped it will not affect amplitude measur...

Страница 100: ...ls The vertical offset control affects the vertical acquisition window and the displayed waveform as follows H The vertical range window is always centered around the offset value It is the voltage level at the middle of the vertical acquisition window With no zero offset as shown in Figure 3 2 a and b that voltage level is zero ground H As you vary vertical offset the middle voltage level moves r...

Страница 101: ...tical acquisition window on the waveform Horizontal Acquisition Window Considerations The instrument lets you define the horizontal acquisition window that is set several parameters that determine the segment of an incoming signal that becomes the waveform record when acquired For background read Waveform Record on page 3 41 These common parameters specify a horizontal acquisition window that is a...

Страница 102: ... Horizontal position Figure 3 4 Horizontal Acquisition window definition Horizontal Scale Versus Record Length Versus Sample Interval Versus Resolution These parameters all relate to each other and specify the horizontal acquisition window Because the horizontal acquisition window must fit in the 10 horizontal division display for most cases you just set the duration of the horizontal acquisition ...

Страница 103: ... Time Duration decreases you set faster scale settings or Time Duration must increase forcing slower scale settings if Record Length increases you set longer record lengths The equation becomes Maximum Record Length Time Duration Min Sample Interval For example at 200 ps div and 10 divisions the record length must be 500 points Max Rec Length 10 divs x 200 ps div 4 ps sample Max Rec Length 500 sam...

Страница 104: ...he horizontal acquisition window determines the waveform records extracted from all signals present at all active channels You can think of the horizontal acquisition window as cutting across any input signals present in the input channels to extract the same slice of time into waveform records See Figure 3 5 Ch4 record Ch3 record Ch2 record Ch1 record Common horizontal position and delay Common t...

Страница 105: ...on 10 seconds are required to fill the waveform record Without roll mode you must wait 10 seconds to see that the position control is set wrong With roll mode you can start seeing results almost immediately The following table indicates which acquisition features and modes are incompatible with other features or modes Control Feature Incompatible with Explanation Average Single shot acquisition Ac...

Страница 106: ...mpling H Hi Res The instrument creates a record point by averaging all samples taken during an acquisition interval Hi Res results in a higher resolution lower bandwidth waveform This mode only works with real time noninter polated sampling A key advantage of Hi Res is its potential for increasing vertical resolution regardless of the input signal Table 3 1 indicates that you can obtain up to 13 s...

Страница 107: ...6 11 13 13 00 5 00E 02 2 50E 06 10 63 13 00 1 00E 03 1 25E 06 10 13 13 00 2 50E 03 5 00E 05 9 47 13 00 5 00E 03 2 50E 05 8 97 13 00 1 00E 04 1 25E 05 8 47 13 00 2 50E 04 5 00E 04 7 80 13 00 5 00E 04 2 50E 04 7 30 13 00 1 00E 05 1 25E 04 6 80 12 80 2 50E 05 5 00E 03 6 14 12 14 5 00E 05 2 50E 03 5 64 11 64 1 00E 06 1 25E 03 5 14 11 14 2 50E 06 5 00E 02 4 48 10 48 5 00E 06 2 50E 02 3 98 9 98 1 00E 07...

Страница 108: ...splaying a noisy square wave signal illustrates the difference between the modes Note how Average reduces the noise while Envelope captures its extremes Sample Envelope Average Peak Detect Hi Res H Waveform Database Using waveform database technology the instrument processes a much larger sample of data The waveform database is a three dimensional accumulation of source waveform data over several ...

Страница 109: ...le Sequence and Mask Pass Fail Testing a sample is only counted if the sample would be displayed in the graticule area In Single Sequence all eligible samples in an acquisition are counted In Mask Test with infinite persistence on all acquisitions acquired in a batch are counted In nondisplay persistence the minimum number of samples for the waveform may include multiple batches of acquisitions In...

Страница 110: ... 3 6 Use untriggered roll to continuously observe a slow process knowing that you can always see the most recent view of that process Math and measurements work after you push STOP Untriggered Roll with Single Sequence CSA7000 Series TDS7000 Series Untriggered roll mode with single sequence displays newly acquired data points at the right edge of the waveform record while moving older waveform dat...

Страница 111: ...ument is not sampling the signal fast enough to construct an accurate waveform record See Figure 3 7 Actual high frequency waveform Apparent low frequency waveform due to aliasing Sampled points Figure 3 7 Aliasing Methods to Check and Eliminate Aliasing To quickly check for aliasing slowly increase the horizontal scale time per division setting If the shape of the displayed waveform changes drast...

Страница 112: ...e H Turn on PeakDetect acquisition mode If the waveform becomes an envelope aliasing was occurring Use the procedure that follows to set the data acquisition mode and specify acquisition start stop methods For more information display online help when performing the procedure Overview To set acquisition modes Control elements and resources Prerequisites 1 Instrument must be powered up with horizon...

Страница 113: ...ample H Peak Detect H Hi Res H Envelope H Average H Waveform Database For Average and Envelope modes only select the number of acquisitions to average or envelope For Waveform Database mode select the number of samples desired Set the stop mode 4 Push the RUN STOP button or touch Run Stop in the Run Stop control window to toggle between starting Running and stopping acquisitions 5 Push the SINGLE ...

Страница 114: ...tion tab 7 Select the sampling mode H Equivalent Time uses both the real time and equivalent time sampling as appropriate see Table 3 2 on page 3 44 H Real Time Only limits the instrument to real time sampling Real Time Only prevents the very fast horizontal scale settings from being selected H Interpolated Real Time limits the instrument to real time sampling If the instrument cannot accurately g...

Страница 115: ...2 Make sure all the channels to be acquired are turned on use channel buttons see To Set Up Signal Input on page 3 13 if needed Then push the RUN button to begin acquiring To stop acquiring 3 Push the RUN STOP button to stop acquisition Acquisition will also stop if triggering ceases while in Normal trigger mode To take a single acquisition 4 Push the SINGLE button to start acquiring and acquire e...

Страница 116: ...Acq control window or select Horizontal Ac quisition Setup from the Horiz Acq menu to display the Acquisition Mode control window Select the Acquisition tab 3 Select Roll Mode AUTO to enable roll mode When the horizontal scale is 100 ms per division at a record length of 500 points and the acquisition mode is Sample or Pk Detect roll mode turns on As the record length becomes larger the time per d...

Страница 117: ...isplay the Acquisition Mode control window Select the Acquisition tab 7 Select Roll Mode OFF to disable roll mode Or whenever you set the Horizontal SCALE to 40 ms per division or faster roll mode turns off At record lengths greater than 500 points the time per division required to turn off roll mode becomes slower Note Envelope Average Fast Acquisition and Waveform Database acquisition modes inhi...

Страница 118: ...setting of channels Digitizer CH 1 Digitizer CH 2 Digitizer CH 3 Digitizer CH 4 Figure 3 8 Digitizer configuration Acquisition is the process of sampling the analog input signal of an input channel converting it into digital data and assembling it into a waveform record which is then stored in acquisition memory Sampling then is the process that provides a waveform record per trigger event see Fig...

Страница 119: ...meters common means that they affect the waveforms in all channels Figure 3 10 shows how these common parameters define the waveform record as shown in the figure they define where in the data stream and how much data is taken Locate the following parameters in the figure H Sample Interval The time between sample points taken during acquisition H Record Length The number of samples required to fil...

Страница 120: ...sition memory and becomes available for display or use in math waveforms storage and so on For a control oriented discussion of the waveform record see Horizontal Acquisition Window Considerations on page 3 23 and Horizontal Scale vs Record Length vs Sample Interval vs Resolution on page 3 24 The two general methods of sampling are real time and equivalent time This instrument uses both real and e...

Страница 121: ...n the sample density required for a waveform record See Figure 3 12 Equiva lent time sampling should only be used on repetitive signals The sampling speeds and the number of channels that you choose affect the mode the instrument uses to sample waveforms H The instrument always real time samples at slower time base settings faster time settings force the instrument to switch from real time samplin...

Страница 122: ...al time sampling Real time sampling Real time sampling 2 5 ns Real time sampling Equivalent Time or Interpolated Sampling TDS6000 Series Real time sampling Equivalent Time or Interpolated Sampling 1 ns Equivalent Time or Interpolated Sampling Equivalent Time or Interpolated Sampling Equivalent Time or Interpolated Sampling TDS7104 TDS7054 20 ns Real time sampling Real time sampling Real time sampl...

Страница 123: ...olate between the samples it acquires Like for equivalent time sampling it does so only when it does not have all the real samples it needs to fill its displayed waveform When setting ZOOM to progressively larger amounts of expansion the instrument then interpolates to create the intervening points in the displayed waveform If the time per division is set fast enough to require equivalent time but...

Страница 124: ...ent time sampling The instrument applies the digitizing resources of unused channels that is channels that are turned off to sample those that are in use turned on Table 3 3 lists how interleaving more than one digitizer to sample a channel extends the maximum digitizing rate Once you set horizontal scale to exceed the maximum digitizing rate for the number of channels in use see Table 3 3 the ins...

Страница 125: ...uous non triggered data from the input channels Measurements and histograms are done directly on the two dimensional array of display pixels In infinite persistence mode the array accumulates more information and measurements are more accurate Some modes features are incompatible with Fast Acquisitions mode and if you select them they will inhibit Fast Acquisitions H FastFrame and Zoom modes H Env...

Страница 126: ...s occurring during the long dead times Typical waveform capture rates are 50 waveforms per second Fast Acquisitions mode increases the waveform capture rate to up to 400 000 waveforms per second updating the waveform array many times between displays This very fast capture rate greatly increases the probability that runts glitches and other infrequent events will accumulate in waveform memory The ...

Страница 127: ...quisitions display Fast acquisitions display Fast acquisitions display Dead time Dead time Dead time Normal DSO mode Fast Acquisition mode 1st acquired waveform record Waveform memory bit maps Waveform memory Waveform memory Waveform memory Waveform memory bit maps Waveform memory bit maps Intensity controls Intensity controls Intensity controls Figure 3 13 Normal DSO Acquisition and Display mode ...

Страница 128: ...00 Series TDS6000 Series Instruments User Manual Fast Acquisition display Normal DSO display Figure 3 14 Normal DSO and Fast Acquisition displays Use the procedure that follows to set up Fast Acquisitions mode To Turn Fast Acquisitions On and Off ...

Страница 129: ...cquisitions mode 2 Enable fast acquisitions in one of two ways 3 Push the front panel FastAcq button or 4 Touch the Horiz button Select the Acquisition tab from the Horiz Acq control window or select Horizontal Ac quisition Setup from the Horiz Acq menu to display the Acquisition Mode control window Select the Acquisition tab 5 Touch Fast Acquisitions to toggle Fast Acquisitions to On Fast Acquisi...

Страница 130: ...and Infinite Display Persistence Off is the factory default setting Variable persistence is explained on page 3 140 No Persistence erases the display each time a new waveform array is displayed If your instrument supports mask testing Mask Autofit can affect persistence When enabled Autofit moves the waveform vertically and horizontally to reduce the number of hits within a given mask If infinite ...

Страница 131: ... brightness depend on the trigger rate creating a display like an analog instrument 13 To change the intensity setting for fast acquisition and waveform database waveforms touch FastAcq WfmDB and enter the intensity value with the keypad or the multipurpose knob To select the color palette 14 Touch the DISP button and select the Colors tab Normal Green and Gray give the appearance of an intensity ...

Страница 132: ...able This mode is particularly useful for studying phase relationships When you set the VERTICAL POSITION and Vertical Offset to center the display in YT mode the XY display is at center screen and each division of display in YT mode produces a division of display in XY mode When you choose the XY format channels are assigned to the axis indicated in Table 3 4 and displayed as part of an XY pair I...

Страница 133: ... signal including position and offset on CH 3 produces a blank screen a 5 division signal produces full intensity For help 3 For more information on the controls described in this procedure touch the Disp or Horiz button Touch the HELP button in the toolbar Table 3 4 XY and XYZ format assignments Instruments Assignments X Axis source Y Axis source Intensity source CSA7000 Series and TDS7000 Series...

Страница 134: ...ingle channel Figure 3 16 shows how FastFrame combines the desired captured frames into one larger waveform For example FastFrame would let you store 4000 frames depending on the record length option installed of 500 samples each into one waveform FastFrame mode lets you jump to and view the frame that you select Time Stamps can display the absolute trigger time for a specific frame and the relati...

Страница 135: ... If any frames were acquired they are displayed If no frames were acquired the previous FastFrame waveform is displayed H Because FastFrame introduces additional processing time into the operation cycle of acquire process and display its best to use Single Sequence Acquisition see Acquire menu Stop After menu With Single Sequence selected you will see the current acquisition sequence otherwise the...

Страница 136: ...Frame mode Control elements and resources Prerequisites 1 The horizontal and vertical controls must be set up Triggering should also be set up See page 3 34 for acquisition setup and page 3 71 for trigger setup To set FastFrame mode 2 Touch the Horiz button Select the Acquisition tab from the Horiz Acq control window Touch FastFrame Setup to display the FastFrame Setup control window 3 Touch FastF...

Страница 137: ... enter the number of the specific frame you want to view The frame that you select appears on the display To view multiple frames 8 In the Frame Viewing controls touch Multiple Frames to toggle it to On 9 In the Frame Viewing control touch Start Frame and use the general purpose knob or keypad to enter the number of the starting frame you want to view Touch of Frames and use the general purpose kn...

Страница 138: ... Turn readouts on or off 3 In the Time Stamps controls touch Readouts to toggle time stamp readouts on or off H On displays time stamp readouts see Figure 3 17 on page 3 62 Time stamps are always acquired H Off turns off the display of time stamp readouts The displayed time uses the following format Sel Ch F xxx DD MMM YYYY HH MM SS mmm nnn ppp Ref Ch F xxx DD MMM YYYY HH MM SS mmm nnn ppp DD MMM ...

Страница 139: ...elected Frame and Reference Frame as previously shown or you can set them from the Selection Controls window 6 Touch Selection Controls from the Time Stamps control window to display the FastFrame controls 7 In the FastFrame controls window touch Selected Frame Source and select the source of the frame you want to view 8 Touch Selected Frame Frame and use the general purpose knob or keypad to ente...

Страница 140: ...tion Controls window 11 Touch either Frame Tracking Live or All to lock the reference and position frames together When the frames are locked they maintain the same relative distance from each other when either frame is adjusted H Live locks together the channel and math waveforms All reference waveforms are locked together but they are separate from the channel and math waveforms H All locks toge...

Страница 141: ...ee Cleaning Optical Connectors on page 3 66 Take care to preserve the integrity of optical connectors by keeping them free of contamination For cleaning information see Cleaning Optical Connectors on page 3 66 The instrument can couple to multimode fibers with a core diameter of 62 5 50 m or singlemode fiber with a core diameter of 9 m Alternate types can be coupled by use of UCI universal connect...

Страница 142: ...D DATA RECOVERED CLOCK Figure 3 18 Optical to Electrical converter and recovered clock and data connectors The optical input connector uses a universal connector interface UCI that allows use of many standard fiber optic female connector styles Some of the standard UCI interfaces supported are FC ST SC and DIN Refer to a current Tektronix catalog for details Clock and data recovery circuitry provi...

Страница 143: ...a will oscillate ELECTRICAL OUT This output is the electrical output from the O E converter Use the supplied adapters to connect to the Ch1 input or other equipment Use the O E Electrical Out to Ch1 Input adapter to connect the Electrical Out of the optical to electrical converter to the CH1 input of the instrument This connection allows you to use the instrument as a calibrated reference receiver...

Страница 144: ...high quality cleaning supplies that are non abrasive and leave no residue To reduce the need for cleaning immediately replace protective caps on the optical connectors when not in use Use the following items to clean optical connectors H Clean dust free compressed air H Fiber optic cleaning swabs H Pure electronics grade isopropyl alcohol NOTE If isopropyl alcohol is used care must be taken to hav...

Страница 145: ...ain is set appropriately for the wavelength you select Before performing dark level calibration remove your optical signal from the input and cover the optical input Select Dark Level Calibration to start the dark level compensation Follow the displayed instructions to complete the compensa tion For more information consult the instrument online help Execute a signal path compensation of the instr...

Страница 146: ...see the CSA7000 TDS7000 TDS6000 Series Option SM Serial Mask Testing and Option ST Serial Triggering User Manual Optical Bandwidth CSA7000 Series Traditionally bandwidth is defined as the frequency at which the power out is one half the power out at a frequency near DC In the voltage domain the power dissipated into a resistive load such as a 50 Ω termination of an input is the VRMS 2 R where VRMS...

Страница 147: ...07 V DC The expression is simplified by cancelling the R and moving the squared term inside the log expression to a multiple outside the log expression 10 logᏋV f 2 R V DC 2 R Ꮠ 2 10 logᏋ V f V DC Ꮠ 20 logᏋ V f V DC Ꮠ In CSA7000 Series instruments the vertical units displayed for an optical module are not in voltage but watts this is a unit of power The optical to elec trical converter inside the ...

Страница 148: ... calculation however the definition is changed to match the industry standard definition which assumes electrical bandwidths are 3 dB 20 log vertical swing at frequency vertical swing at DC The curve calculation of frequency response for the unfiltered settings uses the definition for dB and bandwidth where 3 dB 10 log vertical swing at frequency vertical swing at DC that is the optical bandwidth ...

Страница 149: ...pling holdoff mode and so on H Triggering from the Front Panel which describes how to use the front panel triggering controls each of which is common to most of the trigger types the instrument provides H Additional Trigger Parameters which describes how to access common trigger functions in the Trigger control window H Advanced Triggering which describes trigger types that you can use to isolate ...

Страница 150: ...Triggering Concepts Triggers determine when the instrument stops acquiring and displays a wave form They help create meaningful waveforms from unstable jumbles or blank screens See Figure 3 21 The instrument has simple edge triggers as well as a variety of advanced triggers you can use Triggered waveform Untriggered waveforms Figure 3 21 Triggered versus untriggered displays ...

Страница 151: ...ny one of the four input channels The channel that you select as a trigger source will function whether it is displayed or not H AC Line Voltage is a convenient trigger source when you are looking at signals related to the power line frequency Examples include devices such as lighting equipment and power supplies Because the instrument generates the trigger from the power line you do not have to u...

Страница 152: ...onal on TDS7000 Series TDS6000 Series is a special trigger used on signals with serial data patterns You can trigger on the clock recovered from optical CSA7000 Series only or electrical communication signals The trigger mode determines how the instrument behaves in the absence of a trigger event H Normal trigger mode enables the instrument to acquire a waveform only when it is triggered If no tri...

Страница 153: ...it disables the trigger system until acquisition is complete In addition the trigger system remains disabled during the holdoff period that follows each acquisition You adjust holdoff to obtain stable triggering when the instrument is triggering on undesired trigger events as shown in Figure 3 23 A digital pulse train is a good example of a complex waveform See Figure 3 23 Each pulse looks like an...

Страница 154: ...l At the longer holdoff time for the top waveform unstable triggering occurs With a shorter holdoff set for the bottom waveform triggers all occur on the first pulse in the burst to remedy the unstable trigger Holdoff Holdoff Holdoff Trigger level Holdoff Holdoff Holdoff Holdoff Figure 3 23 Holdoff adjustment can prevent false triggers Trigger coupling determines what part of the signal is passed ...

Страница 155: ...make the pretrigger period large enough to capture data before the glitch By analyzing what happened before the glitch you may uncover clues about its source The slope control determines whether the instrument finds the trigger point on the rising or the falling edge of a signal See Figure 3 24 You set trigger slope by pushing the SLOPE button on the front panel to toggle between the positive goin...

Страница 156: ... from the Front Panel The front panel provides quick access to the most frequently used trigger controls The trigger readout shows you the state of the trigger system The slope coupling and source controls only work for edge triggering To access the advanced trigger controls display the Trigger Control window by pushing the ADVANCED button See Advanced Triggering on page 3 88 for more information ...

Страница 157: ... select and set up other trigger types To select the trigger slope 3 Push the TRIGGER SLOPE button to toggle between POS and NEG H POS triggers on a rising edge positive going signal H NEG triggers on a falling edge negative going signal You can also set the slope in the Trigger control window To set level 4 To manually change the trigger level when edge triggering or certain threshold levels when...

Страница 158: ...a is disrupted removed or heavily distorted the instrument may not acquire lock or may lose lock If the recovered clock is not locked to the incoming data the waveform display will not be stable Once the input data is available press the PUSH SET TO 50 knob to force the instrument to reacquire lock When using Comm triggering pushing the trigger PUSH SET TO 50 knob sets the levels for the selected ...

Страница 159: ...ses only the AC components of an input signal H HF REJ attenuates signals above 30 kHz H LF REJ attenuates signals below 80 kHz H NOISE REJ provides lower sensitivity reducing the chance of falsely triggering on noise To select the trigger mode 8 Push the TRIGGER MODE button to toggle between NORMAL and AUTO trigger modes H NORMAL trigger mode requires a trigger to acquire a waveform H AUTO trigge...

Страница 160: ...waveform H READY on the instrument can accept and is waiting for a valid trigger to occur H ARM on the trigger circuitry is filling the pretrigger portion of the waveform record H TRIG D and READY on valid A trigger recognized waiting for a delayed trigger When a delayed trigger is recognized the posttrigger portion of the delayed waveform will fill H ARM TRIG D and READY off the digitizer is stop...

Страница 161: ...evel indicator shows only the trigger level It remains on screen regardless of the horizontal position as long as the channel providing the trigger source is displayed You can choose between two types of trigger level indicators a horizontal bar or an arrow at the right side of the graticule Trigger point indicator shows the trigger position on the waveform record Trigger level indicator shows the...

Страница 162: ...is random when A only Edge triggering is selected otherwise the holdoff varies with the horizontal scale and is equal to 5 divisions times the current time division setting Auto maintains a good value for general purpose triggering H Time lets you enter a holdoff that may allow more stable triggering than the Auto holdoff This time is used at all horizontal scale settings H Random selects a new ra...

Страница 163: ... to display the keyboard Select either TTL ECL or USER H TTL fixes the trigger level at 1 4 V H ECL fixes the trigger level at 1 3 V H USER fixes the trigger level at the USER preset voltage When you set the volts div smaller than 200 mV the instrument reduces the TTL or ECL trigger levels below standard TTL and ECL levels This reduction occurs because the trigger level range is fixed at 12 divisi...

Страница 164: ...es and select User Preferences to display the User Preferences control window To define new trigger level presets 1 If the Menu Bar is not displayed touch the Menu button to display the Menu Bar 2 Touch Utilities and select User Preferences to display the User Preferences control window 3 Select the Keypad Defaults tab Select a Trigger Level and adjust the Trigger Level preset using the multipur p...

Страница 165: ...cord even without a trigger event touch the Force Trigger button Forcing a trigger is useful when in normal trigger mode and the input signal is not supplying a valid trigger By touching Force Trigger you can quickly confirm that there is a signal present for the instrument to acquire Once that is established you can determine how to trigger on it push PUSH TO SET 50 check trigger source setting a...

Страница 166: ...rm Database mode acquisition stops after N samples are acquired where N is the number of samples specified It may take a number of sequences of acquisitions to fill a waveform to the desired number of samples Single sequence triggering is not available in Fast Acquisition mode Advanced Triggering The instrument can trigger on glitch or runt pulses or it can trigger based on the width slew rate or ...

Страница 167: ... your waveforms Glitch Trigger A glitch trigger occurs when the trigger source detects a pulse narrower or wider than some specified time It can trigger on glitches of either polarity Or you can set the glitch trigger to reject glitches of either polarity Runt Trigger A runt trigger occurs when the trigger source detects a short pulse that crosses one threshold but fails to cross a second threshol...

Страница 168: ...ct an expected pulse transition If the pulse transition occurs prior to a specified timeout time the expected case then no trigger results Pattern Trigger A pattern trigger occurs when the logic inputs to the logic function that you select cause the function to become TRUE or at your option FALSE When you use a pattern trigger you define H The precondition for each logic input logic high low or do...

Страница 169: ... TRUE setting in the Trigger When menu If that menu is set to Goes False swap the definition for AND with that for NAND and for OR with NOR for both pattern and state types 3 The logic inputs are channels 1 2 3 and 4 when using Pattern triggers For State triggers channel 4 becomes the clock input leaving the remaining channels as logic inputs State Trigger A state trigger occurs when the logic inp...

Страница 170: ...he instrument monitors the data and clock sources When a clock edge occurs the instrument checks the data stream it is processing from the data source for transitions occurring within the setup hold violation zone If any occur the instrument triggers with the trigger point located at the clock edge Positive settings for both setup and hold times the most common application locate the setup hold vi...

Страница 171: ...p time TH Hold time Setup Hold violation zone TS TH TS TH must be 2 ns Clock signal Clock level Clock signal Clock level Negative TS Positive TH Positive TS Negative TH TH TH TS TH TS TS Setup Hold violation zone Setup Hold violation zone Setup Hold violation zone Figure 3 26 Violation zones for Setup Hold triggering ...

Страница 172: ... appropriately for the signal to be acquired See page 3 26 for acquisition setup Select glitch triggering 2 From the toolbar touch Trig and select the A Event tab of the Trigger control window 3 Touch Glitch Select the source 4 To specify which channel becomes the trigger source touch Source and select the source from the list Select the polarity and width 5 To specify the glitch polarity touch Po...

Страница 173: ...gnized by the instrument touch Glitch Trigger Level and use the multipurpose knobs keypad or front panel LEVEL knob to set the glitch trigger level Note You can set the level to a value appropriate to either TTL or ECL logic families To do so touch Level and select the keypad touch either TTL or ECL To set mode and holdoff 9 Mode and holdoff can be set for all standard trigger types To learn more ...

Страница 174: ...From the toolbar touch Trig and select the A Event tab of the Trigger control window 2 Touch Runt Select the source 3 To specify which channel becomes the pulse trigger source touch Source and select the source from the list The source selected becomes the trigger source for Glitch Runt Width and Transition Select the polarity 4 To specify the direction of the runt pulse touch Polarity and select ...

Страница 175: ...ide a runt pulse the instrument will trigger on 5 Touch Trigger When Runt and select from the list H Occurs triggers on all runt pulses regardless of width H Wider triggers only on runt pulses that exceed the width you set Enter the width using the general purpose knob or keypad 6 To specify the minimum width of the runt pulse touch Width and set the value using the multipurpose knob or keypad ...

Страница 176: ...elected in the Polarity window determines the order that the threshold must be crossed for a runt trigger to occur H Positive requires that the lower threshold must be first crossed going positive then recrossed going negative without the upper threshold being crossed at all H Negative requires that the upper threshold must be first crossed going negative then recrossed going positive without the ...

Страница 177: ...on page 3 74 and Trigger Holdoff on page 3 75 When you select the type Width the instrument will trigger on a pulse narrower or wider than some specified range of time defined by the upper limit and lower limit To set up for width triggering do the following procedures Overview Trigger based on pulse width Control elements and resources Select width triggering 1 From the toolbar touch Trig and sel...

Страница 178: ...hat are outside this range or within this range do the following steps 5 Touch Trigger When and select from the list H Inside triggers on pulses that fall within the specified range H Outside triggers on pulses that are outside the range 6 To set the range of pulse widths in units of time touch Upper or Lower Limit and enter the values with the general purpose knob or keypad H Upper Limit is the m...

Страница 179: ...n page 3 75 When you select the type Transition Time slew rate the instrument will trigger on a pulse edge that traverses between an upper and lower threshold faster or slower than a transition time you specify To set up for transition time triggering do the following procedures Overview To trigger based on transition time Control elements and resources Select transition triggering 1 From the tool...

Страница 180: ...dge may first cross either threshold and then cross the other Set the transition time The threshold levels and the delta time setting determine the transition time slew rate setting To set these parameters 5 Touch the Upper Level or Lower Level button and use the multipurpose knob or keypad to set the values for the upper and lower levels Note You can set the level to a value appropriate to either...

Страница 181: ...Time greater than and the instrument does not trigger it may be because the pulse edge is too fast rather than too slow To check the edge speed switch to edge triggering Then trigger on the pulse edge and determine the time the edge takes to travel between the levels set in the slew rate Thresholds menu The instrument cannot transition trigger on pulse edges that traverse between threshold levels ...

Страница 182: ...t timeout triggering 1 From the toolbar touch Trig and select the A Event tab of the Trigger control window 2 Touch Timeout Select the source 3 To specify which channel becomes the trigger source touch Source and select the source from the list Set to trigger when 4 Touch Stays High Stays Low or Either from the Trigger When window H Stays High causes a trigger if the signal stays higher than the t...

Страница 183: ...set for all standard trigger types See To set holdoff on page 3 84 and To select the trigger mode on page 3 81 for mode and holdoff setup To learn more about trigger mode and holdoff see Trigger Modes on page 3 74 and Trigger Holdoff on page 3 75 When you select the type Pattern the instrument will trigger when the inputs to the logic function that you select cause the function to become TRUE or a...

Страница 184: ...for each of the input channels Ch1 Ch2 touch each Input Threshold and select either High H Low L or don t care X from the menu To set thresholds 5 To set the logic threshold for each channel select the channel threshold and use the multipurpose knob or keypad to set each threshold To define the logic 6 To choose the logic pattern type you want applied to the input channels touch an available type ...

Страница 185: ...lect False Less Than More Than or True from the list The list items More Than and Less Than are used to time qualify a pattern trigger See the procedure To define a time qualified pattern trigger that follows for instructions To set mode and holdoff 8 Mode and holdoff can be set for all standard trigger types See To et holdoff on page 3 84 and To select the trigger mode on page 3 81 for mode and h...

Страница 186: ...ify Note the position of the trigger indicator Triggering occurs at the point that the instrument determines that the logic function that you specify is TRUE within the time that you specify The instrument determines the trigger point in the following manner H It waits for the logic condition to become TRUE H It starts timing and waits for the logic function to become FALSE H It compares the times...

Страница 187: ...ntrol window 2 Touch State Define inputs 3 To set the logic state for each of the input channels Ch1 Ch2 Ch3 and Ch4 touch each Input Threshold and select either High H Low L or don t care X from the menu The choices for Ch4 are rising POS edge and falling NEG edge Set thresholds 4 To set the logic threshold for each channel select the channel threshold and use the multipurpose knob or keypad to s...

Страница 188: ...ge 3 84 and To select the trigger mode on page 3 81 for mode and holdoff setup To learn more about trigger mode and holdoff see the descriptions Trigger Modes on page 3 74 and Trigger Holdoff on page 3 75 When you select the type Setup Hold the instrument uses one channel as a data channel the factory default setting is Ch1 another channel as a clock channel default is Ch2 and triggers if the data...

Страница 189: ...d clock sources 5 To select the edge to use to clock select either Pos or Neg from the Clock Edge window Set the data and clock levels To set the transition levels that the clock and data must cross to be recognized by the instrument 6 Touch Data Level and use the multipurpose knobs or keypad to set the data level 7 Touch Clock Level and use the multipurpose knobs or keypad to set the clock level ...

Страница 190: ... 2 ns TS TH 2 ns Note Attempting to set either time to reduce the 2 ns limit adjusts the other time to maintain the limit In most cases you will enter positive values for both setup and hold time Positive values set the instrument to trigger if the data source is still settling inside the setup time before the clock or if it switches inside the hold time after the clock You can skew this setup hol...

Страница 191: ...nstrument if a specific condition is met You can choose one of two trigger conditions H Trig After Time After the A trigger arms the trigger system the instrument triggers on the next B trigger event that occurs after the Trigger Delay Time You can set the trigger delay time with the keypad or the multipurpose knobs H Trigger on nth Event After the A trigger arms the trigger system the instrument ...

Страница 192: ... to trigger on your waveforms Trigger Sources In most cases it makes sense to set separate trigger sources for the A Main and B Delayed triggers Line is not available as a source for the B trigger Trigger Types When using sequential triggering the A trigger must be set to one of the following types Edge Glitch or Width The B trigger is always Edge type Using Sequential Triggering ...

Страница 193: ...igger event Trigger delay time Waiting for nth event where n 5 A trigger point Start posttrigger acquisition A trigger source Trig on nth Event A trigger source B trigger source B trigger point Start posttrigger acquisition on first B trigger after delay Waveform record A trigger source B trigger source Trig After Time A Main Only Pretrigger record Posttrigger record Waveform record Waveform recor...

Страница 194: ...and Trig on nth Event when horizontal delay is on Each illustration shows where pretrigger and posttrigger data is acquired relative to the trigger event Horizontal delay Horizontal delay A trigger point Start posttrigger acquisition A trigger source Waveform record A Main Only with Horizontal Delay Pretrigger record Posttrigger record Waiting for nth event where n 4 Trig on nth Event with Horizon...

Страница 195: ... of B trigger events Wait user specified trigger delay time Wait user specified horizontal delay time Wait the user specified number of B trigger events B trigger on events with horizontal delay off B trigger on events with horizontal delay on Wait user specified horizontal delay time B trigger after delay with horizontal delay on Wait for B trigger event Wait user specified horizontal delay time ...

Страница 196: ...ntrol elements and resources Prerequisites 1 The instrument must be installed with a signal connected to an input channel Acquisition system should be set to Run and the vertical and horizontal controls should be set appropriately for the signal to be acquired See page 3 26 for acquisition setup To trigger on a main only 1 From the toolbar touch Trig and select the A B Seq tab of the Trigger contr...

Страница 197: ...set the time base to run after an A trigger a trigger delay and a B trigger from the toolbar touch Trig and select the A B Seq tab of the Trigger control window 2 Touch Trig After Time 3 To set the trigger delay touch Trig Delay and use the multipurpose knob or keypad to set the time 4 To set the B trigger level touch B Trig Level and use the multipurpose knob or keypad to set the level ...

Страница 198: ...A trigger and a specified number of B trigger events from the toolbar touch Trig and select the A B Seq tab of the Trigger control window 2 Touch A Then B Trig on nth Event 3 To set the number of B trigger events touch Trig Event and use the multipurpose knob keyboard or up and down arrows to set the number of events 4 To set the B trigger level touch B Trig Level and use the multipurpose knob or ...

Страница 199: ...A Trig coupling 4 To specify the direction of the edge touch Slope and select Pos positive or Neg negative from the window H Pos monitors positive going edges H Neg monitors negative going edges 5 To set the B trigger level touch B Trig Level and use the multipurpose knob or keypad to set the level Note you can also touch Set 50 to set the B trigger level to the midpoint between the positive and n...

Страница 200: ...Acquisition of low power signals can be enhanced by combining serial trigger and signal averaging to reduce random noise You can specify patterns with up to 32 bits including don t care bits The serial trigger system can be clocked from an external source or from internal clock recovery Serial pattern trigger operates on NRZ encoded signals at data rates up to 1 25 Gb s For detailed information on...

Страница 201: ... a flexible customizable display that you can control to display the waveforms that you acquire This section presents the following topics H Using the Waveform Display H Setting MultiView Zoom Controls H Customizing the Display Acquisition system Input Display Storage Waveform transform system Horizontal timebase Trigger ...

Страница 202: ...p most of the UI application Some terms that are useful in discussing the display follow 4 Horizontal reference 1 Display 3 Horizontal scale readout 2 Graticule Figure 3 31 Display elements 1 Display area The area where the waveforms appear The display comprises the timebase and graticules the waveforms histograms and some readouts 2 Graticule A grid marking the display area When Zoom is on the up...

Страница 203: ...reen H Fast Access to Zoom Waveform inspection has never been easier Just touch and drag a box around the feature of interest and select zoom from the choices offered and the feature of interest displays zoomed in the magnified graticule Both vertical and horizontal zoom functions are available Zoomed waveforms can be aligned locked and automatically scrolled H Acquisition Preview When the next ac...

Страница 204: ...a math waveform by creating a math waveform using existing sources channel math and reference waveforms and measurements This operation can be performed by touching the Math button and then selecting Define Edit Expression When defining a math waveform you turn it on in the Math setup control window Operations on Waveforms In general the method of adjusting vertically scaling offsetting positionin...

Страница 205: ...sition waveform and zoomed waveform windows The 50 50 button allocates half of the available display for the zoomed graticule and half of the available display for the acquisition window The 80 20 button allocates 80 of the available display for the zoomed graticule and 20 for the acquisition window Touch 100 to use the entire display for the zoomed graticule Figure 3 31 on page 3 124 shows the el...

Страница 206: ...and Acquisition Controls For channel waveforms the vertical and horizontal controls that you set also adjust the instrument acquisition parameters See the following descriptions for more information H Vertical Acquisition Window Considerations on page 3 20 H Horizontal Acquisition Window Considerations on page 3 23 Horizontal Position and the Horizontal Reference The time values that you set for h...

Страница 207: ...lay waveforms in the main graticule Related control elements and resources Prerequisites 1 The instrument must be installed and operating 2 The acquisition system should be set to run continuously See page page 3 34 for acquisition setup and page 3 71 for trigger setup Set vertical display parameters 3 Push a channel button to select the waveform it displays A channel button lights when its channe...

Страница 208: ...ed Horizontally The Resolution knob sets the record length See discussion of record length on page 3 24 Push PUSH TO SET TO 50 if required to stabilize display Adjust the horizontal reference 6 To adjust the point around which the waveforms expand and contract touch the Horizontal Reference and drag it left or right on screen Move the Horizontal Reference along the horizontal axis until it aligns ...

Страница 209: ...nctions are available Zoomed waveforms can be aligned locked and automatically scrolled See Setting MultiView Zoom Controls on page 3 131 for more information Explore the zoom controls 9 The next procedure describes setting up and controlling Zoom See Setting Zoom Controls on page 3 131 Setting MultiView Zoom Controls The instrument can expand or compress zoom in or out on a waveform without chang...

Страница 210: ...en zooming horizontally Zoom expands all waveforms at the same time When zooming horizontally or vertically Zoom expands or contracts the waveform by the zoom scale factor Use the procedure that follows to zoom a waveform For more information display online help when performing the procedure Overview To zoom waveforms Control elements and resources Prerequisites 1 The instrument must be installed ...

Страница 211: ...Zoom 3 On or Zoom 4 On to magnify the highlighted waveform segment in one of the 4 zoom areas Note The instrument displays the box enclosed area on the waveform magnified in the graticule If two graticules are shown the magnified waveform is shown in the bottom graticule H Push the ZOOM button to split the screen and add a zoom graticule If the instrument creates two graticules the magnified wavef...

Страница 212: ...ge the zoom factor or move the unmagnified waveform relative to the box the instrument alters the magnified display accordingly to include only the waveform portion within the box As you change the zoom factor or move the magnified waveform the instrument scales or moves the box relative to the unmagnified waveform so that the box encloses only the magnified portion of the waveform If multiple wav...

Страница 213: ...ion and Zoom windows H 50 50 allocates half of the available display for the zoomed graticule and half of the available display for the acquisition window H 80 20 allocates 80 of the available display for the zoomed graticule and 20 for the acquisition window H 100 uses the entire display for the zoomed graticule Note The instrument displays the box enclosed area on the waveform magnified in the g...

Страница 214: ... zoom factor of the selected zoom area H From the Zoom Setup window touch the Vertical or Horizontal Position or Factor controls to assign the multipurpose knobs to the factor and position controls H Use the multipurpose knobs or keypad to change the zoom position and factor The knob readout also displays the zoom position and factor You can also use the up and down arrows to change the zoom facto...

Страница 215: ...to lock on check mark 14 To lock control of the zoom areas selected in the previous step touch Lock to toggle it on 15 To control the automatic scrolling of the selected zoom areas touch an AutoScroll control H Forward H Fast forward H Reverse H Fast reverse H Stop 16 To change the scrolling speed touch Scroll Speed and use the multipurpose knobs or keypad to change the scrolling speed For further...

Страница 216: ...ute Access Menu name1 Entry Options Graticule Style Display Graticule Style Choose from Full Grid Cross hair and Frame styles Disp Objects Choose from Full Grid Cross hair and Frame styles Display Persistence Display Display Persistence Choose from No Persistence Off Infinite Persistence and Variable Persistence Modes Reset the persistence display Set Disp Appearance Variable Persistence Modes Res...

Страница 217: ...in which you can set custom hue lightness and saturation for the selected source Reference Colors Display Colors Choose Default to use the default system color white for reference waveforms Disp Colors Choose Inherit to use the same color for the reference waveform as the original waveform Math Colors Display Colors Choose Default to use the default system color red for math waveforms Disp Colors ...

Страница 218: ...creen saver will display if it is enabled Date and Time Display Display Date and Time Toggle on and off the display of the system date and time Disp Objects Set Date and Time Utilities Set Date and Time Set the date and time using the Set Time and Date setup window that is displayed 1 The Menu Names refer to the menus found in the menu bar or toolbar at the top of the instrument screen Normal and ...

Страница 219: ...te for general use although it may introduce some overshoot or undershoot in signals with fast rise times H Linear interpolation computes record points between actual acquired samples by using a straight line fit The straight line fit assumes all the interpolated points fall in their appropriate point in time on that straight line Linear interpolation is useful for many waveforms such as pulse tra...

Страница 220: ... data from previous waveform acquisitions no persistence H Infinite persistence continuously accumulates record points until you change an acquisition setting H Variable persistence accumulates record points for a specified time Each point decays in a set time interval 4 From Display Style select an available style H Vectors displays lines between waveform dots H Dots displays waveform record poin...

Страница 221: ... acquire resulting in a build up of data in the displayed waveforms H Variable Persistence to make data persist momentarily but also decay New waveform displays accumulate data as new waveform records acquire but with continuous replacement of the oldest data If you select Variable Persistence set a time at which the oldest data fades away H Off to make data display for the current acquisition onl...

Страница 222: ...age 3 71 for trigger setup Change waveform colors 2 From the Display setup control window select the Colors tab 3 Choose a color palette from the Color Palette list Normal Green and Gray give the appearance of an intensity graded display similar to an analog instrument Spectral and Temp use hue to indicate the frequency of occurrence and to highlight events User and User Palette let you create a c...

Страница 223: ... and select the Objects tab 7 Touch Display Date Time to toggle between On and Off On displays the date and time 8 Touch Display Trigger T to toggle between On and Off On displays the trigger T at the trigger location For further assistance 9 Click the Help button in the toolbar to access a context sensitive overview of the display controls and their setup See Accessing Online Help on page 3 283 f...

Страница 224: ...Displaying Waveforms 3 146 CSA7000 Series TDS7000 Series TDS6000 Series Instruments User Manual ...

Страница 225: ...ters See Figure 3 33 H Taking Cursor Measurements on page 3 160 describes using cursors to make measurements on waveforms See Figure 3 33 H Taking Histograms on page 3 168 describes how to take histograms to view the horizontal or vertical distribution of data on your waveforms H Optimizing Measurement Accuracy on page 3 171 tells you how to run compensation routines and how to deskew channels to ...

Страница 226: ...ion describes how to set up the instrument to let it do the work of taking measurements for you Because automatic measurements use the waveform record points and Fast Ac quisitions mode CSA7000 Series TDS7000 Series and Waveform Database mode measurements use a multidimensional array of points automatic measure ments are usually more accurate than cursor and graticule measurements And the instrume...

Страница 227: ... To allow you control over how your waveform data is characterized by measurements the instrument lets you set the methods used for each measurement See High Low Method on page 3 151 and Reference Levels Method on page 3 152 See Statistics on Measurement Results To see how automatic measurements vary statistically you can display a readout of the Min Max Mean and Standard Deviation of the measurem...

Страница 228: ...hey best support your data analysis tasks Measurement Selection The instrument takes automatic measurements of the following categories Amplitude Timing More Histogram and Comm optional on TDS7000 Series TDS6000 Series Check Appendix B Automatic Measurements Supported for a listing of the measurements that you can choose Number of Measurements The instrument can take and update up to eight measure...

Страница 229: ...ach ignores short term aberrations overshoot ringing and so on Histogram is the best setting for examining pulses See Figure 3 35 High Histogram Low Histogram Low Min Max High Min Max High Mean Low Mean Mid reference Figure 3 35 High Low tracking methods H Min max Uses the highest and lowest values of the waveform record This setting is best for examining waveforms that have no large flat portions...

Страница 230: ... related measurements the Hi Mid and Lo references For example the measurement system takes risetime measurements from the waveform edge that transitions from the Low to High reference levels You can set the calculation method for each measurement The instrument provides the following calculation methods refer to Figure 3 36 as you read about each method H Relative Reference Calculated as a percen...

Страница 231: ...evels Overview To take automatic measurements Related control elements and resources Prerequisites 1 Obtain a stable display of the waveform to be measured See page 3 34 for acquisition setup and page 3 71 for trigger setup Select the waveform 2 From the tool bar touch Meas to display the Measure ment setup control window 3 To select the source waveform that you want to measure select the Ch Math ...

Страница 232: ...e measurement list in the control window Measurements are displayed in the right control window area as shown here If the window is occupied or there are too many measurements to fit in that area measurements are displayed in the lower graticule area In Roll mode CSA7000 Series TDS7000 Series measurements are not available until after you stop acquisitions Remove measurements 6 To remove the measu...

Страница 233: ...asurements included in the measurement statistics touch Weight n and use the multipurpose knobs or keypad to set the weighting Annotate measurements Measurement annotation graphically shows the position on the waveform of the elements from which the measurement result is derived Horizontal bars vertical bars horizontal arrows and vertical arrows indicate the elements used by the measurement See Me...

Страница 234: ...en select the Measurement tab to display the Annotation Type setup window 15 From the window select either the Standard or Detailed annotation type Selecting Detailed displays more annotations than selecting standard Set measurement reference levels 16 From the Measurements control window touch Setup Ref Levs to display the Reference Levels setup control window 17 To use these settings for all mea...

Страница 235: ... 35 on page 3 151 H Histogram Selects the most common values above or below the midpoint Since this approach ignores short term aberrations overshoot ringing and so on Histogram is the best setting for examining pulses See Figure 3 35 on page 3 151 H Histogram mean Calculates the mean value using all values either above or below the midpoint depending on whether it is defining the high or low refe...

Страница 236: ...the measurements are being taken on and the reference levels used 22 Snapshot measurements are not continuously updated To update snapshot measurements touch the Snapshot Again button To select the type of snapshot measurements touch one of the Snapshot Type buttons H Comm Selects snapshots of Comm measurements optional on TDS7000 Series TDS6000 Series H General Selects all single waveform measure...

Страница 237: ...form otherwise the entire waveform is included in the measurement Overview To gate a measurement Related control elements and resources Prerequisites 1 Set up as from last procedure See To Take Automatic Measurements on page 3 153 Access gating 2 From the toolbar select Meas and then select Gating from the Measurement setup control window See right To Localize a Measurement ...

Страница 238: ...is between the cursors H Zoom 1 4 Sets the gated area to the waveform area contained in the Zoom graticule H Off Turns off measurement gating Turning V Bar cursors off will not turn gating off You must turn gating off in the Measurement Gating control window or the Zoom drop down list Gate G1 Gate G2 Taking Cursor Measurements Because cursor measurements give immediate feedback of the amplitude or...

Страница 239: ...ay have different sources and therefore can have different volts div settings Vertical cursors T Vertical cursors measure distance time in seconds or bits Each cursor measures with respect to H T1 Time Cursor 1 with respect to the trigger point H T2 Time Cursor 2 with respect to the trigger point H T Time Cursor 2 Time Cursor 1 Time is divisions of displacement of the cursor from its source trigge...

Страница 240: ...rsor Setup control window 3 divisions at 100 mv div 3 divisions at 20 mv div Figure 3 37 Horizontal cursors measure amplitudes Cursors are Display Limited You cannot move a cursor off screen Also if you resize waveforms the cursors do not track That is a cursor stays at its screen position ignoring changes to horizontal and vertical scale and position and vertical offset waveform cursors will trac...

Страница 241: ...is set to 20 mV per division so cursor readout v2 measures R4 relative to its ground as 3 divisions x 20 mV div or about 60 mV H Note that the value of each graticule division is not readily apparent relative to the delta readout because the delta amplitude readout v must account for the different amplitude scale settings of the sources To do so the v readout displays the results of v2 v1 60 mV 30...

Страница 242: ...DELAY to 0 0 and set Horizontal Ref to 0 Now the Horizontal position readout shows the time following the first point and adding this value to the cursor readout yields the cursor position on screen relative to first point You can find the horizontal readout both in the control window and in the readout at the bottom of the screen The following relationships hold Time from First Point Horiz Positi...

Страница 243: ...ltipurpose knobs also work with other controls If a setup window item has an adjustable value you can adjust it with the multipurpose knob or keypad after touching the setup control NOTE To make small changes with the multipurpose knobs push the FINE button before turning the knob When a FINE button is illuminated its multipur pose knob makes smaller adjustments You must target the cursors to the ...

Страница 244: ...e tab and then the waveform to take cursor measurements on see right If you are using Waveform or Screen cursors your must select a source for both cursors by first touching a cursor button before selecting a source Note If a waveform is not available its source button is grayed out Select a cursor type 4 From the Cursor Type menu select the H Bars V Bars Waveform or Screen cursor type See Table 3...

Страница 245: ...tain a fixed horizontal or vertical distance between each other 8 To return to the Cursor controls window touch the Controls button 9 To toggle the display of cursors on or off touch the Cursor button Note All adjustments that you can make in the Cursor controls window can also be made in this window Set cursor style 10 To change the waveform and screen cursor marker style from the Cursor controls...

Страница 246: ...ams constructed from the selected waveform data You can display both vertical voltage and horizontal time histograms but only one at a time Use histogram measurements to get statistical measure ment data for a section of a waveform along one axis Horizontal histogram Histogram measurements Figure 3 39 Horizontal histogram view and measurement data ...

Страница 247: ... counting and data accumulation A sample histogram display is shown in Figure 3 39 Histogram data is continuously accumulated until you explicitly turn off histograms This allows you to continue collecting histogram data even when you turn off the histogram display Use the procedure that follows to quickly take a measurement based on the default settings for histograms Overview To start and reset ...

Страница 248: ...n the histogram box H Off Turns off histogram counting and display Note This control turns on histogram counting and data display You can only display one type of histogram at a time 5 Touch Reset to reset the histogram count Histograms track numbers of counts Clicking Reset resets those counts to zero and begins counting from zero Set histogram display options 6 Touch Display to toggle the displa...

Страница 249: ... Location controls to set the location of the histogram box Table B 1 on page B 1 includes a list of the available histogram measurements and a brief description of each Optimizing Measurement Accuracy The procedures given here will increase the accuracy of the measurements that you take This instrument can compensate itself and the attached probes optimizing the internal signal path used to acqui...

Страница 250: ...t Instrument Calibration See right Check the calibration status 3 The calibration status should be Pass If the status is Warm up wait until the status changes If the status does not change to Pass use the following steps to calibrate the instrument Note Signal Path Compensation is the only calibration that is accessible to users Calibrate the instrument 4 Touch Calibrate to start the calibration C...

Страница 251: ...xture to the instrument use the procedure in the manual that came with your deskew fixture Overview To connect the probe calibration fixture Related control elements and resources Prerequisites 1 Instrument should be powered on Allow a 20 minute warm up See page 3 34 for acquisition setup and Power on the Instrument on page 1 9 Overview This fixture converts the PROBE COMPENSATION output into a se...

Страница 252: ...ation that you want to perform Probe Operation Input Passive voltage probes P6139A Low frequency compensation A Gain and offset calibration A Deskew voltage probes A Deskew TCP202 probe B Deskew CT 6 probe A Active voltage probes P6243 P6245 Gain and offset calibration A P6246 P6247 Deskew voltage probes A P6248 P6249 Deskew TCP202 probe B P7240 P7260 Deskew CT 6 probe A P7330 Current probes TCP20...

Страница 253: ...ins are sharp Refer to these diagrams to attach your probe tip to the fixture Refer to the ground symbols on the fixture to establish the correct polarity P6243 or P6245 Connect the probe tip to the short pin and the probe ground to the long pin as shown Square pin adapter Square pin ground socket P7260 Connect the probe to the two long pins Connect the probe ground to the long pin that is marked ...

Страница 254: ...6248 or P7330 Connect the probe input to the signal pin and the probe input to the ground pin as shown There is no connection to the probe ground input TCP 202 Snap the current probe closed around the current loop as shown Be sure to align the polarity arrows on the current probe and the fixture CT 6 After you are finished with this probe be sure to replace the small jumper Remove the small jumper...

Страница 255: ...0 Series TDS7000 Series and TDS6404 To compensate the instrument so that it can take accurate measurements based on the ambient temperature use the procedure that follows TDS6604 To compensate the instrument so that it can take accurate measure ments based on the ambient temperature use the procedure in the manual that came with your deskew fixture Overview To calibrate probes Related control elem...

Страница 256: ...to the fixture 5 If compensating a passive probe first perform the To Compensate Passive Probes procedure on page 3 180 6 From the toolbar touch the VERT button to display the instrument Vertical setup control window 7 Touch the Probe Cal button to display the vertical Probe Cal control window 8 Select the instrument channel to which the probe is attached Note Clear Probecal Erase will erase any p...

Страница 257: ...l button to display the vertical Probe Cal control window 13 Select the instrument channel to which the probe is attached 14 Check the Probe Status readout See right H Initialized Indicates that the probe has not been calibrated on the selected channel H Pass Indicates that the probe has been calibrated on the selected channel Note Probes without a TekProbe interface cannot be calibrated For furth...

Страница 258: ... 3 34 for acquisition setup and Power on the Instrument on page 1 9 Use adapter CSA7404 CSA7154 TDS7404 TDS7254 and TDS7154 2 If your probe is a 1 M Ohm probe without a TCA interface connect it to the instrument using a TCA 1MEG adapter Low frequency compensation 3 Connect fixture to the instrument see To Connect Probe Calibration Fixture on page 3 173 4 Connect one probe to the fixture 5 Push the...

Страница 259: ...ngths The instrument applies deskew values after it completes each acquisi tion therefore the deskew values do not affect logic triggering Also deskew has no affect on fast acquisition XY and XYZ display formats CSA7000 Series TDS7000 Series and TDS6404 To deskew channels use the procedure that follows TDS6604 To deskew channels use the procedure in the manual that came with your deskew fixture Ov...

Страница 260: ... the center of the display The red pointer is the trigger position and all channels will be aligned to this point 8 Adjust the horizontal SCALE so that the differences in the channel delays are clearly visible 9 From the toolbar touch the VERT button to display the Vertical setup control window 10 Touch the Probe Deskew button to display the channel deskew control window 11 Select one of the chann...

Страница 261: ...ew Cont 12 Touch Deskew Time and use the multipurpose knobs or keypad to adjust the deskew time for that channel so that its signal aligns with the trigger position 13 Repeat steps 11 and 12 for each additional channel that you want to deskew 14 Remove the connections For further assistance 15 Touch the Help button to access the online assistance See page 3 283 to learn about using online help ...

Страница 262: ...ing results are reported live providing real time feedback Mask hits are highlighted on the display and accompanied by readouts indicating the number of waveforms tested pass fail results and hit counts Figure 3 40 Pass Fail mask testing If the Bessel Thompson filter is on the instrument is an optical reference receiver For detailed information on using Serial Mask Testing to test your signals for...

Страница 263: ...ound noise You can obtain a cleaner waveform by subtracting the background noise from your original waveform note that the background noise you subtract must be identical to the noise in your signal Or you can integrate a single waveform into an integral math waveform as shown below Source waveform Math waveform With spectral analysis you can analyze waveforms in the frequency domain The interface...

Страница 264: ...e FFT waveform of the phase response Figure 3 41 Spectral analysis of an impulse Defining Math Waveforms This instrument supports mathematical combination and functional transforma tions of waveforms it acquires Figure 3 42 shows this concept Channel waveform Ch2 Math waveform Math1 Diff Ch2 Math expression Function source Figure 3 42 Functional transformation of an acquired waveform ...

Страница 265: ...can use the measurement feature this instrument provides to measure the average of a waveform and subtract it from the original waveform to define a new math waveform You can create up to four math waveforms see Using Math on page 3 188 for more examples Math waveforms can be used in other math Math waveforms autoscale when the math waveform is first defined and turned on Advanced functions such a...

Страница 266: ...erands which can be channel waveforms reference waveforms math waveforms or measurements scalars You can display and manipulate these derived math waveforms much like you can the channel and reference wave forms see Operations on Math Waveforms on page 3 197 Some examples of typical math waveforms follow Table 3 11 Math expressions and the math waveforms produced To Enter this math expression and ...

Страница 267: ...nnel source that clips its data also clips the waveform data supplied to the math waveform H Changes to the acquisition mode globally affects all input channel sources thereby modifying any math waveforms using them For example with the acquisition mode set to Envelope a Ch1 Ch2 math waveform will receive enveloped channel 1 and channel 2 data and therefore will also be an envelope waveform H Clea...

Страница 268: ...eform Ref1 Ref2 Ref3 Ref4 MathWaveform Math1 Math2 Math3 Math4 UnaryOperator Average Integral Derivative Invert Sqrt Exp log 10 log e Fabs Sin Min Max Ceil Cos Tan ASin Sinh ACos Cosh ATan Tanh Floor Spectral Magnitude Spectral Phase Spectral Real Spectral Imag BinaryOperator CHS EXX The logical operators generate a vector that is all 0 0 or 1 0 Operators and are not provided but if x and y are ex...

Страница 269: ...ifferentiated The math waveform derived from the sampled waveform is computed based on the following equation Yn X n 1 Xn 1 T Where X is the source waveform Y is the derivative math waveform T is the time between samples Since the resultant math waveform is a derivative waveform See Figure 3 43 its vertical scale is in volts second its horizontal scale is in seconds The source signal is differenti...

Страница 270: ... and Scale The settings that you make for offset scale and position affect the math waveform that you obtain Note the following tips for obtaining a good display H You should scale and position the source waveform so that it is contained on screen Off screen waveforms may be clipped resulting in errors in the derivative waveform H You can use vertical position and vertical offset to position your ...

Страница 271: ...ver its entire record length therefore the math waveform record length equals that of the source waveform Offset and Position When creating integrated math waveforms from live channel waveforms consider the following topics H You should scale and position the source waveform so that it is contained on screen Off screen waveforms may be clipped which will result in errors in the integral waveform H...

Страница 272: ...nels and references contain data measurement scalars are defined and so on See page page 3 34 for acquisition setup and page 3 71 for trigger setup Display the math control window 2 From the toolbar touch the Math button to display the Define Math control window Select a math waveform 3 Select the Math x tab for the math waveform that you want to define Be sure to touch Display to toggle it on so ...

Страница 273: ...scalars defined H Math definitions are not implemented if sources or other elements of the definition are not valid H Use the backspace button to remove the last entry use the clear key to remove the entire expression and start over H Use parentheses to group terms in the expression to control execution order for example 5 Ch1 Ch2 Select a function 6 Select the Time Freq Meas or Var tabs to displa...

Страница 274: ...mber of averages affect math waveforms if the Avg function is used 12 Touch Close to close the window touch Editor to open the Define Edit Expression window touch Setup to open the math control window or touch Spect to open the Spectral control window Finished 13 Once you have defined the math expression to your satisfaction click the the apply button Then click on the OK button to dismiss the dia...

Страница 275: ...osition from the sources that you include in its math expression You can adjust these controls for the source waveforms and your adjustments will reflect in the math waveform as the sources update You can also magnify all waveforms including math waveforms using zoom Basically you use the same techniques to work with math waveforms that work with channel waveforms Consider the Source Changes to so...

Страница 276: ...Math waveform must be defined and displayed See the reference listed at right See To Define a Math Waveform on page 3 194 Select and display 2 Touch the Math button to display the Math control window 3 Touch any Math x tab to make that math waveform the selected waveform H If the waveform that you select is not defined use the To Define a Math Waveform procedure starting on page 3 194 to define th...

Страница 277: ...hanged the same effect happens with channel waveforms You can touch and drag a waveform handle to change the waveform vertical position You can adjust the waveform vertical position and scale by first touching the waveform handle and then using the multipurpose knobs to adjust the scale and position You cannot adjust the offset of a math waveform You cannot adjust horizontal scale position and sam...

Страница 278: ...tic measurements 5 Touch the Meas button select the Math tab and touch a math button to choose a math waveform from Math1 Math4 See right 6 Select a measurement for more information see Taking Automatic Measurements on page 3 148 Click the Help button in the menu bar for more information 7 To display the measurement touch Display to toggle it to on 8 Read the results in the measurements readout ...

Страница 279: ...ing either the H Bars V Bars Waveform or Screen buttons for more information see Taking Cursor Measurements starting on page 3 160 12 Turn the multipurpose knobs to position each cursor on the math waveform to measure the feature that interests you 13 Read the results in the cursor readout The cursor readout is displayed under the multipurpose readouts or in the upper right corner of the graticule...

Страница 280: ...omain Controls You can operate the spectral analyzer using traditional spectrum analyzer controls You can set the center frequency span and resolution bandwidth directly H Time Domain Controls The spectral analyzer has time domain controls for the acquired waveform These controls set the time duration and the resolution time between samples You can easily set the required sample rate and record le...

Страница 281: ...urning a control on one analyzer changes the control on the other analyzer to the same value Other combinations of locking including all four analyzers are available using GPIB commands The same exclusions for math waveforms apply to spectral math waveforms In addition sources for spectral math waveforms must be channel waveforms Read the following topics they provide details that can help you cre...

Страница 282: ...es the time between samples Duration is kept constant as resolution is changed Therefore the Resolution control affects both the sample rate and the record length simultaneously H Most often you will want to use a short record length because long record lengths can slow instrument response However long record lengths lower the noise relative to the signal and increase the frequency resolution for ...

Страница 283: ...n 1 ms Record length 25 Record length 50 Duration 2 ms Resolution 0 04 ms Record length 25 Duration 2 ms Resolution 0 08 ms Duration 2 ms Record length 100 Resolution 0 02 ms Adjust Duration via sample rate Adjust Duration via record length Adjust Resolution Duration remains constant Figure 3 45 Duration and resolution control effects ...

Страница 284: ...Gate position Gate Trigger position Duration Figure 3 46 Definition of gate parameters The gate must reside within the duration interval of the source waveform If the source waveform duration is adjusted and the gate position and width would result in the gate being outside of that duration then the gate position or width is set within the limits The width of the gate affects the resolution bandwi...

Страница 285: ...waveform duration adjust the sample rate control If you decrease the sample rate the span setting may decrease if necessary to keep the span less than the sample rate divided by two H Center This is the frequency at the center of the spectral waveform Center is equal to the start frequency plus one half of the span The adjustment range depends on the sample rate and the current span setting Rememb...

Страница 286: ... domain gate markers move as you adjust the RBW control RBW Window Bin Width Gate Width Where the Window Bin Width is the resolution bandwidth in units of bins It depends on what window function is used The gate width is in units of seconds Figure 3 47 demonstrate the effects of adjusting center frequency and span Center frequency is a horizontal position control for the spectrum Span is a horizon...

Страница 287: ...te width 200 Increase the center frequency Decrease the center frequency Set center frequency back to 1 and decrease the Span Decrease the Span again Increase resolution by reducing Resolution BW increasing the gate length Increase resolution again by reducing the Resolution BW doubling the gate length Start Stop Figure 3 47 Effects of frequency domain control adjustments ...

Страница 288: ... zero dB The following equation applies dB 20 logᏋ X Ref Ꮠ H If the input units are watts the the following equation applies dB 10 logᏋ X Ref Ꮠ Where X is a complex data point in the spectrum and Ref is the Reference Level Offset value H dBm This selects dB as described in the above equation but it also sets the Reference Level Offset to a value that is equivalent to 1 mW of power into 50 Ω Theref...

Страница 289: ...the marker associated with the spectral waveform Adjusting the reference level offset causes the spectral waveform to move vertically with respect to the waveform reference marker This moves the waveform without changing the Reference Level control setting Sometimes it is beneficial to adjust this control so that the peak of a fundamental is at zero dB Then you can measure other harmonics in terms...

Страница 290: ...button and then selecting the Phase tab Select the desired scale type from Degrees Radians or Group Delay H Phase Reference Position Phase is a relative measurement that must have a time domain reference point The phase value is specified with respect to this phase reference position For the spectral analyzer the phase reference position is the 50 position of the gate that is the middle of the gat...

Страница 291: ...s for the largest magnitude in the current span Phase unwrap is then performed in both directions in frequency from that point This results in a stable phase unwrap H Phase Spectrum dejitter An instrument acquisition system jitters by one sample interval Signals at the Nyquist frequency only have two samples per cycle This would cause 180_ of phase jitter if it were not corrected The instrument ph...

Страница 292: ...g When performing impulse response testing of a system place the impulse at the zero phase reference position of the acquisition This produces a correct phase display Because the Tek Exponential window has its zero phase reference position at the 20 point more of the impulse response is captured All other window functions have their phase reference position at the 50 position in the gated region T...

Страница 293: ...the accuracy of the magnitude and phase measurements Figure 3 51 shows how the time domain record is processed Source waveform Waveform after windowing Window function Hanning FFT Point by point multiply With windowing Waveform data points Zero fill Figure 3 51 Windowing the time domain record Accurate magnitude measurements require that the input source waveform be stationary within the gate regi...

Страница 294: ... 13 dB 50 1 0 Hamming 1 3 1 78 dB 43 dB 50 0 543478 0 456522 Hanning 1 44 1 42 dB 32 dB 50 0 5 0 5 Kaiser Bessel 1 72 1 02 dB 69 dB 50 0 40243 0 49804 0 09831 0 00122 Blackman Harris 1 92 0 81 dB 92 dB 50 0 35875 0 48829 0 14128 0 01168 Gaussian 2 0 0 76 dB 79 dB 50 a 3 75 not cosine series Flattop2 3 8 0 0065 dB 90 dB 50 0 213348 0 206985 0 139512 0 043084 0 003745 Tek Exponential 1 42 0 60 dB 67...

Страница 295: ...n the frequency of the observed signal is exactly half way between two frequency samples of the spectrum when the interpolation ratio due to zero fill of the FFT is one The spectral analyzer FFT length is controlled so that zero fill is always in effect This essentially eliminates scallop loss because zero fill in the time domain causes interpolation in the frequency domain This results in accurat...

Страница 296: ...main gate that is the reference point for phase in the output spectrum That is if a sine wave input has its peak at the zero phase reference position then it reads out as zero phase in the spectrum If the phase is to be correct when doing impulse response testing the impulse in the time domain must be located at this position in the gate interval H Coefficients These are used to generate the windo...

Страница 297: ...at the time domain shape of an exponential Gaussian function transforms into a Gaussian exponential shape in the frequency domain This window provides optimal localization in both the time and the frequency domain This is the filter shape most commonly used in spectrum analyzers 1 0 Amplitude Time 79 dB side lobe 0 80 dB Frequency bins Figure 3 53 Time and frequency graphs for the Gaussian window ...

Страница 298: ... 54 This means the data samples in the gate are not modified before input to the spectral analyzer This window has the narrowest resolution bandwidth of any of the windows but it also has the most spectral leakage and the highest side lobes 1 0 Amplitude Time 13 dB side lobe 0 80 dB Frequency bins 40 Figure 3 54 Time and frequency domain graphs for the Rectangular window ...

Страница 299: ...t the ends see Figure 3 55 This makes it a good choice if you wanted to process the real and imaginary parts of the spectrum off line and inverse transform it back to the time domain Because the data does not taper to zero you could then remove the effect of the window function from the result 1 0 Amplitude Time 43 dB side lobe 0 80 dB Frequency bins 40 Figure 3 55 Time and frequency graphs of the...

Страница 300: ...lop losses see figures 3 56 3 57 and 3 58 Choose the one that best allows you to view the signal characteristics that you are interested in The Blackman Harris has a low amount of energy leakage compared to the other windows The Hanning has the narrowest resolution bandwidth but higher side lobes 1 0 Amplitude Time 32 dB side lobe 0 80 dB Frequency bins 40 Figure 3 56 Time and frequency graphs for...

Страница 301: ...g Math Waveforms CSA7000 Series TDS7000 Series TDS6000 Series Instruments User Manual 3 223 1 0 Amplitude Time 67 dB side lobe 0 80 dB Frequency bins 40 Figure 3 57 Time and frequency graphs for the Kaiser Bessel window ...

Страница 302: ...de lobe 0 80 dB Frequency bins 40 Figure 3 58 Time and frequency graphs of the Blackman Harris window H Flattop2 Window This window has the lowest scallop loss of any of the windows see Figure 3 59 It also has a wider resolution bandwidth but lower side lobe attenuation Also it is unique because the time domain shape has negative values ...

Страница 303: ... TDS7000 Series TDS6000 Series Instruments User Manual 3 225 1 0 Amplitude Time 90 dB side lobe 0 80 dB Frequency bins 40 120 0 dB 0 05 0 1 Scallop loss is 0 0065 dB Frequency bins Figure 3 59 Time and frequency domain graphs for the Flattop2 window ...

Страница 304: ...the time domain gate The frequency domain shape is triangular Use this window for impulse response testing where the 20 position is the zero phase reference point More of the acquired data record length is used to capture the impulse response Exact details of how to compute its values were published in the article Impulse response testing lets a single test do the work of thousands by John Pickerd...

Страница 305: ...ge mode or Hi Res acquisition mode affects the frequency response of the instrument This is due to the one sample of jitter in the acquisition system Both High Res and average acquisition modes have the same affect on the frequency response These modes cause the response to roll off from a magnitude value of one at DC to a magnitude value of 0 63 at Nyquist which is the frequency equal to one half...

Страница 306: ...the harmonics unwrap to different frequency locations Higher order harmonics usually have decreasing magnitudes compared to lower order harmonics Thus if you see a series of increasing harmonic magnitude values as frequency increases then you can suspect that they may be aliased In the spectral math waveform the actual higher frequency components are undersampled and therefore they appear as lower...

Страница 307: ...eform use cursors to measure its frequency amplitude or phase angle See Taking Cursor Measurements on page 3 160 To Take Automated Measurements of a Spectral Math Waveform You can use automated measurements to measure spectral math waveforms Use the procedure To Take Automated Measurements on page 3 153 Swept Sine Wave Analysis Many applications of the spectral analyzer require swept sine wave inp...

Страница 308: ...erence Waveforms and automatic measurement scalars that you will use in your math waveform must be available channels and references contain data measurement scalars are defined and so on See page page 3 34 for acquisition setup and page 3 71 for trigger setup Display the math control window 2 From the toolbar touch the Math button to display the Define Math control window Select a predefined spec...

Страница 309: ...e 3 34 for acquisition setup and page 3 71 for trigger setup Display the math control window 2 From the toolbar touch the Math button to display the Define Math control window Select spectral analysis setup 3 Touch Spectral Analysis Setup and then select the Create tab to display the Spectral Analysis Setup control window Select a spectral waveform 4 Touch Math x and select the math waveform that ...

Страница 310: ...ries TDS7000 Series TDS6000 Series Instruments User Manual Overview Related control elements and resources To define a spectral math waveform Cont Display the spectral waveform 8 To display your spectral waveform touch either the Apply or the OK button ...

Страница 311: ...n adjust the scale and position by first touching the waveform handle and then using the multipurpose knobs to adjust the scale and position 11 To set the reference level touch Level and use the multipurpose knobs or keypad to set the reference level Note Reference level is the value at the top of the display screen It only applies to magnitude waveforms Adjusting the reference level positions the...

Страница 312: ...oupDelay unwraps the phase spectrum and displays its negative derivative The topic Using the Phase Controls on page 3 212 provides in depth information on the setup for phase displays 15 To specify whether to unwrap phase in a spectral analysis phase waveform touch Unwrap to toggle it on or off 16 To set the level in dB that a magnitude in the spectrum must exceed to have its phase computed to red...

Страница 313: ...available FFT windows H Rectangular Best type of window for resolving frequencies that are very close to the same value Best type for measuring the frequency spectrum of nonrepetitive signals and measuring frequency components near DC H Hamming Hanning Blackman Harris Kaiser Bessel and Flattop2 These window are based on cosine series Each has a different RBW and spectral leakage characteristics Us...

Страница 314: ...over which the spectral analysis is performed touch Freq Span and use the multipurpose knobs or keypad to set the frequency range Higher sample rates allow you to set greater frequency spans To set the frequency span to the maximum allowed by the current sample rate touch the Full button 21 To set the center frequency of the spectral analysis touch Center Freq and use the multipurpose knobs or key...

Страница 315: ...t waveform Note Resolution is the inverse of Sample rate Adjust resolution to adjust sample rate Resolution will also cause a change in record length such that the duration is kept constant at the value selected by the Duration control 24 To adjust the number of seconds over the duration of the acquired waveform record length touch Duration and use the multipurpose knobs or keypad to adjust the du...

Страница 316: ... the cursor readout The cursor readout is displayed under the multipurpose readouts as shown here or in the upper right corner of the graticule area The figure shows the cursor measurement of a frequency magnitude on an FFT The readout reads about 0 dB 8 0 mdB because it is aligned with the reference level offset The other readout reads 10 97 dB indicating the magnitude of the frequency it is meas...

Страница 317: ...83 for an overview of the online help system The following procedure is an example of setting up the instrument to perform spectral analysis of a signal This example uses the probe compensation signal available on the front panel of the instrument Overview Spectral math example Control elements and resources Install the test hookup 1 Connect the probe compensation signal to CH 1 through a suitable...

Страница 318: ...ned Mag button The instrument sets up a predefined magnitude spectral analysis waveform 8 To see the settings touch the Spectral Analysis Setup button H Scale sets the vertical scale factor and lets you set the vertical scale H Reference sets the value at the top of the display and offset sets the waveform position with respect to its ground reference H Rec Length sets the number of samples in the...

Страница 319: ...the spectral analyzer The gate position is the time from the trigger to the zero phase reference position in the gate H Gate Duration sets the width of the gate in seconds and it is inversely proportional to the resolution bandwidth For narrow band frequency resolution use a wide gate H Gate Length displays the number of samples over the specified gate duration H Resolution BW sets the bandwidth i...

Страница 320: ...s 11 To assign the cursors to the spectral analysis math waveform touch the Cursor Source Math tab and touch the Math 1 button 12 Use the multipurpose knobs or keypad to set the Curs1 Pos to 0 0 Hz and the Curs2 Pos to 100 kHz The cursor readout now indicates the frequency span set in step 9 13 Use the multipurpose knobs or keypad to set the Curs2 Pos to 50 kHz The cursor readout now indicates the...

Страница 321: ...urs2 Pos to 11 0 kHz In this example the cursors are now on the third and eleventh harmonic of the probe compensation signal Read the frequencies from the cursor readouts 15 Touch the Cursor Type Waveform button Touch the Cursor 2 button and then the Math 1 button Now in addition to the frequency at the cursor locations the cursor readout displays the amplitude at the cursor locations The readout ...

Страница 322: ...0 Series TDS6000 Series Instruments User Manual Overview Control elements and resources Spectral math example cont For more information 16 For additional information on setting up and using spectral math see Defining Spectral Math Waveforms starting on page 3 202 ...

Страница 323: ...er recall limited only by the space you have to store the setups By saving and recalling different setups you can switch from setup to setup without having to first manually record your settings and then manually set them This capability is helpful when you want to H Save and recall a setup that optimizes the instrument for displaying and analyzing a certain signal H Save a series of setups to hel...

Страница 324: ...rm data Upon setup recall however the recalled math waveform expressions will be applied but math waveform data is not restored H User Options that are stored in the Windows Registry These include all options accessed by first selecting Utilities menu bar and then User Preferences Utilities menu You cannot recall into a channel or a math waveform The instrument recalls each waveform into one of th...

Страница 325: ... without entering a file name each time To auto increment file names select Auto increment file name on the dialog box as shown in Figure 3 62 Figure 3 62 Auto increment file name feature Enter a Base file name and click Save For the initial save the default count is 000 Your first file is saved as Basefilename count ext where ext is the file extension On subsequent saves the instrument searches f...

Страница 326: ...d resources Prerequisites 1 The instrument must be powered up 2 Setup the instrument controls as you want them saved as part of a recallable setup For help in making your setup check the references at right and other sections in this chapter specific to the setup you wish to make H See Powering On the Instrument on page 1 9 H See page 3 34 for acquisition setup H See page 3 71 for trigger setup Di...

Страница 327: ...w name replacing the default file name Note You can use the mouse or touch screen with the virtual keyboard to type entries in the name field H Clicking the existing name and using an attached keyboard to enter a new name To save to a file 6 To display the Save Instrument Setup As dialog from the Setup control window touch Save The Save Instrument Setup dialog allows for the entry of a file name f...

Страница 328: ...creen with the virtual keyboard to type entries in the name fields and comments fields Select the Auto increment file name check box to save a series of files without typing in a new name each time For more information see Using Auto Increment File name on page 3 247 9 If not selected select set in the Save as type field as the type of file to save Setup files are always type set Note Only change ...

Страница 329: ...splay the setups control window 2 From the toolbar touch Setups and select the Recall Setups tab of the Setups control window Recall the setup 3 Touch the number of the setup that you want to recall The current instrument setup is overwritten Recall setup from a file 4 To display the Recall Instrument Setup dialog from the Recall Setup control window touch Recall See right The Recall Instrument Se...

Страница 330: ...ng name in the file list H Clicking in the File name field and typing a new name replacing the default file name Note If your instrument lacks a keyboard touch or click on the icons as indicated right to display a virtual keyboard You can use the mouse or touch screen with the virtual keyboard to type entries in the name fields and comments fields Access to virtual keyboard Recall your setup 8 Cli...

Страница 331: ...four references you can save the additional reference to disk for recall later The Reference Waveform control window contains a Label field for including comments with your saved waveforms Using comments you can store informa tion readable upon recall describing each waveform that you save Virtual Keyboarding If you do not have a keyboard connected you can still enter comments and name waveform fi...

Страница 332: ...ve math waveform or an active reference Display the waveform with the setup in which you want to save it For help in setup and acquiring waveforms check the references at right H See Powering On the Instrument on page 1 9 H See page 3 34 for acquisition setup H See page 3 71 for trigger setup Display the reference control window 3 From the toolbar touch Refs and select the Ref 1 to Ref 4 tab of th...

Страница 333: ... and the vertical position of the waveform using the Label control window H Using the menu bar select Vertical and then Label H From the Label control window select the waveform that you want to label using the Source buttons H From the Label control window touch Label and use your keyboard or the pop up keyboard to create a label for your waveform H Position the label relative to the waveform usi...

Страница 334: ...ng to file naming the waveform file and selecting the file format Select a destination 8 Use the Save in drop down list and buttons see right to navigate to the directory in which to save your waveform Select directory and name file 9 Specify the file name in which to save your waveform You can H Use the default name and directory appearing in the File Path field H Rename the file by typing a new ...

Страница 335: ...g waveforms touch the Help button in the toolbar to access the contextual online help See page 3 283 to learn about using online help Use the procedure that follows to recall a waveform to a reference You can only recall waveforms into references NOTE Reference waveforms do not recall because they are already reside in the instrument You can copy a reference waveform to another reference first dis...

Страница 336: ...nce in which you want to recall the waveform Recall the waveform 3 If recalling an internal reference touch Display to toggle the display of the reference waveform on Recall a reference waveform from a file 4 To display the Recall Reference Waveform window from the Recall Ref x from File window touch Recall See right The Recall Reference Waveform window allows navigation to directories lists wavef...

Страница 337: ...le list H Clicking in the File name field and typing a new name replacing the default file name Note If your instrument lacks a keyboard touch or click the keyboard icon to display a virtual keyboard You can use the mouse or touch screen with the virtual keyboard to type entries in the name fields Access to virtual keyboard Recall your waveform 8 Click the Recall button to recall the waveform file...

Страница 338: ...ed up You must have access to a waveform saved by the instrument H See Powering On the Instrument on page 1 9 Display the reference control window 2 From the toolbar touch Refs and select the tab Ref 1 to Ref 4 of the reference that you want to delete Delete the reference 3 Touch Delete to delete the reference waveform Delete a reference waveform file 4 To display the Delete Reference Waveform win...

Страница 339: ...arily see any other types of files in the current directory Otherwise leave it set to wfm for waveforms 7 Choose your waveform file by clicking an existing name in the file list Note If your instrument lacks a keyboard touch or click the keyboard icon to display a virtual keyboard You can use the mouse or touch screen with the virtual keyboard to type entries in the name fields Access to virtual k...

Страница 340: ...mport these waveforms directly If you intend to recall a waveform later save it see the procedure To Save Your Waveform on page 3 254 instead of exporting it You may also choose to copy a waveform and paste it directly into an application such as Microsoft Word or Excel If so select your waveform and then select Copy in the Edit menu File Formats To make exported files more useful you may select a...

Страница 341: ...e instrument hard disk a floppy disk or third party storage device Overview To save a waveform Control elements and resources Prerequisites 1 The instrument must be powered up 2 Make sure the waveform image or measurement to be exported exists that is your source must be a channel an active math waveform an active reference and so forth H See Powering On the Instrument on page 1 9 H See page 3 34 ...

Страница 342: ...S7000 Series TDS6000 Series Instruments User Manual Overview Control elements and resources To save a waveform Cont Select setup for export 4 From the menu bar select File and then select Export Setup to display the Export Setup control window ...

Страница 343: ...our exported images 7 In the View window select whether you want to export the Full Screen or Graticules Only 8 In the Image window select whether you want to export using Normal InkSaver or InkSaver with Enhanced Waveform Color Mode H Normal exports the image exactly as it appears on screen H InkSaver exports the image with a white back ground H InkSaver with Enhanced Waveform Color exports the i...

Страница 344: ...t of your exported waveform file see File Formats on page 3 262 for information on the available formats 12 Touch Source Waveform and select the source of the waveform a channel math or reference waveform to export from the list 13 If you want waveform scale factors and time values included in your MathCad Mathlab files click Include waveform scale factors if not checked only voltage vertical valu...

Страница 345: ...e of the data to include in the exported files H Save Samples between Cursors to include data between the cursors in the exported files H Save Samples in Zoom Area to include data in zoom area 1 2 3 or 4 in the exported files H All to include all data in the exported files 16 If using FastFrame select the frame range to include in the exported files H All Frames to include all frames in the export...

Страница 346: ...ontrol window 18 Touch Data Format and select the data format text or numeric from the list 19 Select the Measurements that you want to export H Displayed Measurements exports measurements that are displayed on screen H Measurements Snapshot exports a snapshot of all measurements H Histogram Data exports current histogram data 20 Select OK to accept your changes Cancel to close the window without ...

Страница 347: ...e PRINT button will export your file Do the following to attach the PRINT button to Export H From the menu bar select File and then select Export Setup to display the Export Setup control window H Touch Set Print button to Export 22 The Export window lists all available waveforms allows for browsing to the destination directory naming the file and selecting the file format Select a destination 23 ...

Страница 348: ...e name field H Rename the file by typing a new name into the File name field H Select the Auto increment file name check box to save a series of files without typing in a new name each time For more information see Using Auto Increment File Name on page 3 247 Note If your instrument lacks a keyboard touch or click the keyboard icon buttons to display a virtual keyboard You can use the mouse or tou...

Страница 349: ...page 3 254 Import the waveform data 3 In Excel select Open from the File menu Use the window that pops up to navigate to the directory containing the file Note If using MS Excel 2000 skip the next step 4 In the dialog that displays make the selections as shown at the right as you navigate through the Text Import Wizard You must select delimiter as your data type comma as the delimiter type and Gen...

Страница 350: ... sure Built In is selected Then select either of the following H Lines in the Standards Types tab H Smooth lines in the Custom Types tab Finish the chart 8 Click Next to step through the next two steps accepting the defaults setting at each step Click the Finish button in step 4 You should have a waveform display similar to that shown at the right Note This procedure assumes MS Excel 97 You can li...

Страница 351: ...e copied exists that is your source must be a channel an active math waveform an active reference and so forth H See Powering On the Instrument on page 1 9 H See page 3 34 for acquisition setup H See page 3 71 for trigger setup Select for copy 2 From the menu bar select Edit and then select Select for Copy See right The menu lists all available waveform image and measurement types available for ex...

Страница 352: ...o display the Images control window 5 In the Palette window select Color GrayScale or Black White for the color palette of your copied images 6 In the View window select whether you want to copy the Full Screen or Graticules Only 7 In the Image window select whether you want to copy using Normal or InkSaver Mode Setup to copy waveforms 8 Select the Waveforms tab to display the Waveforms control wi...

Страница 353: ... click Include waveform scale factors 11 Touch Data Ordering and select the data order top first bottom first top first rotate 90 degrees or bottom first rotate 90 degrees from the list 12 In the Waveform data range window select the data to include in the exported files H Samples to enter the data range of the data to include in the exported files H Save Samples between Cursors to include data be...

Страница 354: ...re ments control window 15 Select Displayed Measurements to copy measurements that are displayed on screen select Measurements Snapshot to copy a snapshot of all measurements or select Histogram Data to copy histogram data in comma separated values format 16 Touch Data Format and select the data format text or numeric from the list Copy your file 17 Select OK to accept your changes and copy the fi...

Страница 355: ...play Windows help and access its section on printers To print a waveform from the front panel push the front panel PRINT button The display screen will print on the default printer For additional print options see the topics that follow To print a waveform from the application menu bar select the File menu and then select Print The instrument displays the standard MS Windows 2000 Print window show...

Страница 356: ...trait format Figure 3 64 Hardcopy formats H Palette select either Color GrayScale or Black White H View select either Full Screen or Graticule s Only H Full Screen displays both the graticule and menu areas of the screen H Graticule s displays only the graticule area of the display H Image select either Normal InkSaver or InkSaver with Enhanced Waveform Color Mode H Normal exports the image exactl...

Страница 357: ...re 3 65 Page setup window To preview your printout from the application menu bar select the File menu and then select Print Preview The instrument displays the standard MS Windows 2000 Print Preview window shown in Figure 3 66 Access the Windows help system for more information To Preview the Page ...

Страница 358: ...ced by a weather map The instrument uses a blank dark gray image that is electronical ly replaced by the graticule and the waveforms that are currently being displayed If you load the bitmap into a program such as Paint the graticule and waveforms are not part of the bitmap and although they are visible on Paint s window they will not be saved or printed To capture the instrument screen with its g...

Страница 359: ... and time 2 From the toolbar touch Disp and select the Objects tab 3 Touch Display Date Time to toggle it on To set the date and time 4 From the menu bar touch Utilities and select Set Time Date to display the Set Time and Date control window 5 Touch Hour Minute or Second and use the multipur pose knobs keypad or arrow buttons to enter the time 6 Touch Year Month or Day and use the multipurpose kn...

Страница 360: ... Guide locate the Product Software CD that was shipped with the instrument Install the CD in the personal computer that you want to use typically your instrument controller Follow the directions in the CD booklet You can install the guide in the instrument but that may not be convenient because it will cover the instrument screen For information on connecting the instrument to a network to enable ...

Страница 361: ...ffec tively is found online where you can quickly access it and display it on your instrument screen You need to access the online documentation for most operating information A few keys to remember when using online help follow H Use online help when you want to minimize interruption to your work flow Help Topics are there when you need more details about a feature H Use the manuals for instructi...

Страница 362: ...esources Prerequisites 1 The instrument must be powered up and running See Installation page 1 5 For in depth contextual overviews 2 When using the toolbar and you have a control window displayed touch the Help button to open the help system with an overview of the control window that is currently displayed 3 Some windows have a help button as shown at the right Click the button to open the help s...

Страница 363: ...t Touch an outlined control shown in the help window to receive more specific information about the control Touch a tab in a help window to navigate between the Overview and specific topics Touch the Minimize button in a help window to move the help out of the way so you can operate the instrument Touch the Restore Help button to see the last help topic again ...

Страница 364: ... To dig deeper 4 You can search for help using the usual methods available for help on a PC From the menu bar select Help and then select Contents and Index See right 5 From the online help finder see below choose from the three tabs 6 Click to explore the topic titles and to highlight one for display Click the Display button to open the topic in a help window ...

Страница 365: ... in the Contents or Index tabs of the online finder you may want to enable full text search From the application menu bar select Help and then select Contents and Index See right 8 From the online help finder see below choose the Find tab 9 Choose the method for word list generation and select next or finish Once the word list generation finishes clicking the Find tab will access a pane for search...

Страница 366: ...Accessing Online Help 3 288 CSA7000 Series TDS7000 Series TDS6000 Series Instruments User Manual ...

Страница 367: ...s unless noted otherwise To meet specifica tions the following conditions must be met H The instrument must have been calibrated in an ambient temperature between 20 C and 30 C 68 F and 86 F H The instrument must be operating within the environmental limits listed in Table A 11 on page A 38 H The instrument must be powered from a source that meets the specifications listed in Table A 9 on page A 3...

Страница 368: ...ate digitizers for each channel Acquisition on multiple channels is always concurrent The digitizers can also be combined to yield a higher sample rate on a single channel Fast Acquisition CSA7000 Series TDS7000 Series only Acquire up to 400 000 waveforms per second to see rapidly changing signals or intermittent signal irregularities Long Record Lengths Choose record lengths from 500 points up to...

Страница 369: ...vailable for selected optical communications standards Average Envelope and Hi Res Acquisition Use Average acquisition mode to remove uncorrelated noise from your signal Use Envelope to capture and display the maximum variation of the signal Use Hi Res to increase vertical resolution for lower bandwidth signals Waveform Math Set up simple math waveforms using the basic arithmetic functions or crea...

Страница 370: ... Zoomed waveforms can be aligned locked and automatically scrolled Cursors Use cursors to take simple voltage time and frequency measurements Automatic Measurements Choose from a large palette of amplitude time and histogram measurements You can customize the measurements by changing reference levels or by adding measurement gating Mask Testing Optional on TDS7000 Series TDS6000 Series Provides ma...

Страница 371: ...le switch from the touch screen interface If convenient you can also install a mouse and keyboard to use the interface Toolbar or Menu Bar You can choose a toolbar operating mode that is optimized for use with the touch screen or a PC style menubar operating mode that is optimized for use with a mouse Open Desktop The instrument is built on a Microsoft Windows software platform the instrument appl...

Страница 372: ...indow is automatically shown if you touch the help button Graphical aids in the help windows assist you in getting to the information you need You can also access the help topics through a table of contents or index Specification Tables Table A 2 Channel input and vertical specifications Characteristic Description Input channels Four Input coupling Channel input is disconnected from input terminat...

Страница 373: ... voltage CSA7404 CSA7154 TDS7404 TDS7254 TDS7154 1 VRMS for 100 mV division settings and 5 VRMS for 100 mV settings Maximum voltage at input 1 VRMS for 100 mV settings and 7 V f 100 V tti TDS6604 TDS6404 7 VRMS for 100 mV settings Maximum voltage at input BNC TDS7104 TDS7054 1 MΩ 150 VRMS CAT I For steady state sinusoidal waveforms derate at 20 dB decade above 200 kHz to 9 VRMS at 3 MHz and above ...

Страница 374: ... CSA7154 TDS7404 TDS7254 TDS7154 Measurement type DC accuracy in volts Average acquisition mode 16 aver ages 2 mV div to 3 98 mV div 2 5 6 net offset 1V reading net offset offset accuracy 0 08 division V division 4 mV div to 99 5 mV div 2 2 net offset 1V reading net offset offset accuracy 0 08 division V division 100 mV div 2 2 net offset 10V reading net offset offset accuracy 0 08 division V divi...

Страница 375: ...he same setup and ambient conditions and all other automatic measurements 1 0 reading 0 1 div V div setting 0 3 mV Net offset is the nominal voltage that must be applied to the channel to bring the trace to center screen Net offset offset position volts division and is expressed in volts n DC voltage measurement accuracy TDS6604 TDS6404 Measurement type DC accuracy in volts Average acquisition mod...

Страница 376: ... 122 F derated by 30 MHz C below 15 C 59 F SCALE range Bandwidth CSA7404 CSA7154 TDS7404 TDS7254 TDS7154 2 mV div to 3 9 mV div DC to 1 GHz TDS7254 TDS7154 4 mV div to 9 9 mV div DC to 1 25 GHz CSA7404 CSA7154 TDS7404 TDS7254 TDS7154 TDS6604 TDS6404 10 mV div CSA7404 TDS7404 DC to 4 GHz TDS7254 DC to 2 5 GHz CSA7154 TDS7154 DC to 1 5 GHz TDS6604 DC to 6 GHz TDS6404 DC to 4 GHz Analog bandwidth wit...

Страница 377: ...DC to 1 25 GHz 10 mV div CSA7404 TDS7404 DC to 3 5 GHz n Analog bandwidth TDS7104 TDS7054 DC 50 Ω coupling bandwidth limit set to Full operating ambient 30 C derated by 2 5 MHz C above 30 C SCALE range Bandwidth 1 mV div to 1 99 mV div TDS7054 DC to 450 MHz TDS7104 DC to 500 MHz 2 mV div to 4 98 mV div TDS7054 DC to 500 MHz TDS7104 DC to 600 MHz 5 mV div to 9 95 mV div TDS7054 DC to 500 MHz TDS710...

Страница 378: ...0 Ω coupling bandwidth limit set to Full SCALE range Rise time 1 mV div to 1 99 mV div TDS7054 890 ps TDS7104 800 ps 2 mV div to 4 98 mV div TDS7054 800 ps TDS7104 667 ps 5 mV div to 9 95 mV div TDS7054 800 ps TDS7104 533 ps 10 mV div to 1 V div TDS7054 800 ps TDS7104 400 ps Lower frequency limit AC coupled TDS7104 TDS7054 10 Hz for 1 MΩ reduced by a factor of ten when using a 10X probe 200 kHz fo...

Страница 379: ... 1 5 V step 20 ns 2 1 ms 0 1 100 mV div to 1 V div with 3 V step 20 ns 2 1 ms 0 2 TDS7104 TDS7054 Bandwidth limit set to Full SCALE range and step amplitude Settling error at time after step 1 mV div to 100 mV div with 2 V step 20 ns 0 5 100 ns 0 2 20 ms 0 1 101 mV div to 1 V div with 20 V step 20 ns 1 0 100 ns 0 5 20 ms 0 2 1 01 V div to 10 V div with 200 V step 20 ns 1 0 100 ns 0 5 20 ms 0 2 TDS...

Страница 380: ...r less 400 ps TDS6604 TDS6404 2 5 GS s or less 50 ps Position range 5 divisions Offset range CSA7404 CSA7154 TDS7404 TDS7254 TDS7154 TDS6604 SCALE range Offset range TDS7254 TDS7154 TDS6604 TDS6404 CSA7404 CSA7154 TDS7404 TDS7254 TDS7154 2 mV div to 50 mV div TDS6604 TDS6404 10 mV div to 50 mV div 0 50 V 50 5 mV div to 99 5 mV div 0 25 V 100 mV div to 500 mV div 5 V 505 mV div to 1 V div 2 5 V TDS...

Страница 381: ...Offset accuracy TDS7254 TDS7154 2 mV div to 9 95 mV div 0 2 net offset 1 5 mV 0 1 div V div setting 10 mV div to 99 5 mV div 0 35 net offset 1 5 mV 0 1 div V div setting 100 mV div to 1 V div 0 35 net offset 15 mV 0 1 div V div setting TDS7104 TDS7054 SCALE range Offset accuracy 1 mV div to 100 mV div 0 2 net offset 1 5 mV 0 1 div V div setting 101 mV div to 1 V div 0 25 net offset 15 mV 0 1 div V...

Страница 382: ... only 5 1 bits 4 GHz CSA7404 TDS7404 only 4 9 bits TDS7054 Sine wave input at the indicated frequency and pk pk amplitude at 50 mV division and 25 C Signal and input conditions Effective bits 1 MHz 9 2 div 2 GS s sample rate Sample acquisition mode 6 8 bits 1 MHz 9 2 div 10 MS s sample rate HiRes acquisition mode 8 7 bits 500 MHz 6 5 div 2 GS s sample rate Sample acquisition mode 6 8 bits TDS7104 ...

Страница 383: ...ale and coupling settings TDS7104 TDS7054 50 ps between any two channels with the same scale and coupling settings n Channel to channel crosstalk CSA7404 CSA7154 TDS7404 TDS7254 TDS7154 15 1 at rated bandwidth CSA7404 TDS7404 TDS7254 only and 80 1 at 1 5 GHz or the rated bandwidth whichever is less Assumes two channels with the same scale settings TDS7104 TDS7054 100 1 at 100 MHz and 30 1 at the r...

Страница 384: ... 1 25 S s to 5 GS s 3 or 4 1 25 S s to 2 5 GS s TDS7104 1 1 25 S s to 10 GS s 2 1 25 S s to 5 GS s 3 or 4 1 25 S s to 2 5 GS s TDS6604 TDS6404 1 or 2 5 S s to 20GS s 3 or 4 5 S s to 10GS s Equivalent time sample rate or interpolated waveform rate range Equivalent time acquisition can be enabled or disabled When disabled waveforms are interpolated at the fastest time base settings CSA7404 CSA7154 T...

Страница 385: ...1 000 000 points 1 or 2 channels only 2 000 000 points 1 channel only Option 2M installed 2 000 000 points 3 or 4 channels 4 000 000 points 1 or 2 channels only 8 000 000 points 1 channel only Option 3M installed 4 000 000 points 3 or 4 channels 8 000 000 points 1 or 2 channels only 16 000 000 points 1 channel only Option 4M installed CSA7404 CSA7154 TDS7404 TDS7254 TDS7154 8 000 000 points 3 or 4...

Страница 386: ... Maximum record length HiRes mode sample rate 1 25 GS s CSA7404 CSA7154 TDS7404 TDS7254 TDS7154 2 000 000 points 1 2 3 or 4 channels Seconds division range CSA7404 CSA7154 TDS7404 TDS7254 TDS7154 TDS6604 TDS6404 50 ps div to 10 s div TDS7104 TDS7054 200 ps div to 40 s div Maximum FastFrame update rate nominal CSA7404 CSA7154 TDS7404 TDS7254 TDS7154 TDS7104 TDS7054 160 000 frames per second ...

Страница 387: ... 4M 5321 48192 500 points Standard 580 3560 Option 2M 2381 14632 Option 3M 4765 29272 Option 4M 4765 29272 5000 points Standard 163 720 Option 2M 669 2968 Option 3M 1339 5936 Option 4M 1339 5936 50 000 points Standard 19 80 Option 2M 81 328 Option 3M 163 656 Option 4M 163 656 500 000 points Standard 2 8 Option 2M 8 32 Option 3M 16 64 Option 4M 16 64 TDS7104 TDS7054 50 points Standard 645 2936 Opti...

Страница 388: ...tion off n Internal time base reference frequency CSA7404 CSA7154 TDS7404 TDS7254 TDS7154 TDS6604 TDS6404 10 MHz 2 5 ppm over any 100 ms interval Aging 1 ppm per year n Long term sample rate and delay time accuracy CSA7404 CSA7154 TDS7404 TDS7254 TDS7154 TDS6604 TDS6404 2 5 ppm over any 100 ms interval Aging 1 ppm per year TDS7104 TDS7054 15 ppm over any 1 ms interval Aperture uncertainty typical ...

Страница 389: ... Ts or 150 ps whichever is greater and acquired 10 mV Div where Ts is the sample period Conditions Accuracy Single shot signal Sample acquisition mode Full bandwidth 0 06 sample rate 2 5 ppm reading RMS 0 3 sample rate 2 5 ppm reading peak Average acquisition mode 100 aver ages Full bandwidth 4 ps 2 5 ppm reading peak TDS7104 TDS7054 For a single channel with signal amplitude 5 div reference level...

Страница 390: ...4 TDS7404 TDS7254 TDS7154 TDS6604 TDS6404 All sources for vertical scale settings 10 mV div and 1 V div Trigger Source Sensitivity Main trigger DC coupled 0 5 div from DC to 50 MHz CSA7404 TDS7404 TDS6604 TDS6404 1 5 div at 3 GHz CSA7154 TDS7154 1 div at 1 5 GHz Delayed trigger DC coupled 0 5 div from DC to 50 MHz increasing to 1 div at 1 5 GHz Auxiliary input DC coupled 250 mV from DC to 50 MHz i...

Страница 391: ...J Same as DC coupled limits for frequen cies 200 kHz attenuates signals 200 kHz TDS7104 TDS7054 All sources for vertical scale settings 10 mV div and 1 V div Trigger coupling Sensitivity NOISE REJ 3 the DC coupled limits AC Same as DC coupled limits for frequen cies 60 Hz attenuates signals 60 Hz HF REJ 1 5 the DC coupled limits from DC to 30 kHz attenuates signals 30 kHz LF REJ 1 5 the DC coupled...

Страница 392: ...r Width type Minimum difference between upper and lower limits 1 ns 2 ns 5 of upper limit setting or 25 ns whichever is smaller Transition type Minimum transition time 600 ps 8 5 ns 5 of transition time setting or 25 ns whichever is smaller Timeout type Minimum timeout time 1 ns 2 ns 5 of timeout setting Pattern type typical Minimum time the pattern is true 1 ns 1 ns State type typical Minimum tru...

Страница 393: ...dge 100 ns to 100 ns Hold time time from clock edge to data transition 1 ns to 102 ns Setup time Hold time algebraic sum of the two settings 2 ns n Advanced trigger timer accuracy For Glitch Timeout or Width types Time range Accuracy 1 ns to 500 ns 20 of setting 0 5 ns 520 ns to 1 s 0 01 of setting 100 ns Trigger level or threshold range CSA7404 CSA7154 TDS7404 TDS7254 TDS7154 TDS6604 TDS6404 Trig...

Страница 394: ...nel 2 setting net offset 0 3 div volts div setting offset accuracy Auxiliary Not calibrated or specified where net offset offset position volts division TDS6604 TDS6404 Edge trigger DC coupling for signals having rise and fall times 1 ns Trigger Source Accuracy Any channel 2 setting net offset 0 35 div volts div setting offset accuracy 10 mV div only Auxiliary Not specified where net offset offset...

Страница 395: ... 8 ns for settings 1 2 s A dither of 4 ns is added to the holdoff setting Table A 4 Serial Trigger specifications optional on TDS7000 Series TDS6000 Series Characteristic Description Serial trigger number of bits 32 Serial trigger encoding types NRZ nSerial trigger baud rate limits Up to 1 25 GBd Serial trigger serial word recognizer position accuracy Edge trigger DC coupling for signals having a ...

Страница 396: ...requested baud Minimum signal amplitude needed for clock recovery typical 1 division p p up to 1 25 GBd 1 5 divisions p p above 1 25 GBd Table A 5 Display specifications Characteristic Description Display type 211 2 mm 8 4 in W 158 4 mm 6 3 in H 264 mm 10 4 in diagonal liquid crystal active matrix color display Display resolution 640 horizontal 480 vertical pixels Pixel pitch 0 33 mm horizontal 0 ...

Страница 397: ...llel port IEEE 1284 DB 25 connector supports the following modes standard output only bidirectional PS 2 compatible bidirectional enhanced parallel port IEEE 1284 standard mode 1 or mode 2 v 1 7 bidirectional high speed extended capabilities Serial port DB 9 COM1 port uses NS16C550 compatible UARTS transfer speeds up to 115 2 kb s Keyboard port PS 2 compatible instrument must be powered down to ma...

Страница 398: ... into a 10 kΩ load Vol 1 6 V Voh 2 V typical TDS7104 TDS7054 1 0 V from base to top 1 0 into a 50 Ω load 1 kHz 5 n Analog Signal Output amplitude CSA7404 CSA7154 TDS7404 TDS7254 TDS7154 TDS6604 TDS6404 BNC connector provides a buffered version of the signal that is attached to the channel 3 input when channel 3 is the trigger source 20 mV div 20 into a 1 MΩ load 10 mV div 20 into a 50 Ω load Offse...

Страница 399: ...tage Vout high Vout low true 2 5 V into open circuit 1 0 V into 50 Ω load 0 7 V with 4 ma sink 0 25 V into 50 Ω load Serial data output baud rate range CSA7000 Series only Fbaud 1250 MBd Output swing of 1010 repeating pattern at this baud will be at least 200 mV into 50 Ω Serial clock output frequency range CSA7000 Series only Peak to peak output swing at 625 MHz is at least 200 mV p p into 50 Ω H...

Страница 400: ...sive Average of 16 waveforms The delta between any two averages of 16 waveforms acquired under the same setup and ambient conditions 2 2 net offset 1 mW reading 0 16 div W div Excludes normal variations due to fiber connection to the front of the instrument nOptical Channel Bandwidth includes O E O E to TekConnect adaptor and instrument 5 _C to 25 _C CSA7404 2 4 GHz CSA7154 1 6 GHz DC conversion g...

Страница 401: ...4 dB for 780 nm 20 nm 14 dB for 850 nm 20 nm With 9 m core singlemode fiber SMF 28 28 dB for 1310 nm 20 nm 28 dB for 1550 nm 20 nm The return loss includes optical reflection contributions from the device under test s SC SPC connector interface with the user s PC style connector as well as all other optical reflections from that interface up to and including the device under test s final photo dio...

Страница 402: ...W per division to 500 W per division Optical reference receiver typically available from the following scale factors 1310 nm and 1550 nm 13 5 W per division to 66 W per division 850 nm 25 W per division to 125 W per division 780 nm 28 W per division to 142 W per division 2 All specifications are with the O E electrical out to CH1 input adapter installed Table A 8 Data storage specifications Charac...

Страница 403: ...046 00 Bussman ABC 8 Littelfuse 314008 5 mm 20 mm size IEC127 sheet 1 fast acting F high breaking capacity 6 3 A 250 V Bussman GDA 6 3 Littelfuse 21606 3 Table A 10 Mechanical specifications Characteristic Description Weight Benchtop configuration CSA7404 CSA7154 TDS7404 TDS7254 TDS7154 TDS7104 TDS7054 17 7 kg 39 lbs instrument only 19 1 kg 42 lbs with fully accessorized pouch 38 8 kg 85 5 lbs whe...

Страница 404: ... 19 in width 435 mm 17 13 in depth Cooling Fan forced air circulation with no air filter Required clearances Top 0 mm 0 in Bottom 19 mm 0 75 in minimum or 0 mm 0 in when standing on feet flip stands down Left side 76 mm 3 in Right side 76 mm 3 in Front 0 mm 0 in Rear 0 mm 0 in on rear feet Construction material Chassis parts are constructed of aluminum alloy front panel is constructed of plastic l...

Страница 405: ...s total 3 axis Table A 12 Certifications and compliances Category Standards or description EC Declaration of Conformity EMC Meets intent of Directive 89 336 EEC for Electromagnetic Compatibility Compliance was demonstrated to the following specifications as listed in the Official Journal of the European Union EN 61326 Emissions 1 3 Class A Radiated and Conducted Emissions EN 61326 Immunity 1 2 4 I...

Страница 406: ...is allowed provided that the function is self recoverable or can be restored by the operation of the controls TDS7104 TDS7054 The performance criteria for when the oscilloscope is subjected to the conditions described above are defined as follows A 0 2 division waveform displacement or 0 4 division increase in peak to peak noise B temporary self recoverable degradation or loss of performance is al...

Страница 407: ... designations The installation categories are CAT III Distribution level mains usually permanently connected Equipment at this level is typically in a fixed industrial location CAT II Local level mains wall sockets Equipment at this level includes appliances portable tools and similar products Equipment is usually cord connected CAT I Secondary signal level or battery operated circuits of electron...

Страница 408: ...Appendix A Specifications A 42 CSA7000 Series TDS7000 Series TDS6000 Series Instruments User Manual ...

Страница 409: ...red over the entire waveform or gated region Cycle Mean Voltage measurement The arithmetic mean over the first cycle in the waveform or the first cycle in the gated region Cycle RMS Voltage measurement The true Root Mean Square voltage over the first cycle in the waveform or the first cycle in the gated region Delay Timing measurement The time between the MidRef crossings of two different traces o...

Страница 410: ...cle Timing measurement of the first cycle in the waveform or gated region The ratio of the negative pulse width to the signal period expressed as a percentage NegativeDutyCycle NegativeWidth Period 100 Negative Overshoot Voltage measurement Measured over the entire waveform or gated region NegativeOvershoot Low Min Amplitude 100 Negative Width Timing measurement of the first pulse in the waveform ...

Страница 411: ...ess than and half are greater than this value StdDev The standard deviation Root Mean Square RMS deviation of all acquired points within or on the histogram box Hits in Box Displays the number of points in the histogram box or on the box boundary Waveform Count Displays the number of waveforms that have contributed to the histogram Peak Hits Displays the number of points in the largest bin of the ...

Страница 412: ...semean 3 PBasesigma Eye Width The eye width in seconds y y Eye Width TCross2mean 3 TCross2sigma TCross1mean 3 TCross1sigma Crossing The eye crossing point as a percentage of eye height Crossing 100 PCross1mean PBasemean PTopmean PBasemean Eye Top The top of the eye Eye Base The base of the eye Jitter Pk Pk The peak to peak value for the edge jitter in the current horizontal units p p g j Jitter PP...

Страница 413: ...ng measured at the MidRef as a percent of the eye period percent of the eye period DCD 100 x TDCDp p TCross2mean TCross1mean Quality Factor Ratio of eye size to noise y y Quality Factor PTopmean PBasemean PTopsigma PBasesigma Levels Used in Taking Amplitude Timing and Area Measurements Refer to Figure B 1 and the descriptions that follow to interpret the definitions of waveforms in categories Ampl...

Страница 414: ...rements as Period and Duty Cycle Typically set to 50 You can choose how this level is set see Reference Levels Method on page 3 152 LowRef The waveform low reference level Used in fall and rise time calcula tions Typically set to 10 You can choose how this level is set see Reference Levels Method on page 3 152 Mid2Ref The middle reference level for a second waveform or the second middle reference ...

Страница 415: ... These areas are used with a specified sample size to statisti cally measure the following values H PTopmean the mean value of PTop H PTopsigma the standard deviation of PTop H PToppk pk The vertical peak to peak deviation of PTop H PBasemean the mean value of PBase within the Eye Aperture1 H PBasesigma the standard deviation of PBase within the Eye Aperture1 H PBasepk pk the vertical peak to peak...

Страница 416: ...mean of the left crossing point at PCross1 The T2 values are vertical and horizontal values associated with the rightmost crossing point These areas are used to establish the following directions H TCross2mean the horizontal mean of the right crossing point at TCross2 H TCross2sigma the horizontal standard deviation of the right crossing point at TCross2 H TCross2p p the horizontal peak to peak de...

Страница 417: ...the time of the Max Min 1 horizontal bar indicating the Min value 1 vertical arrow indicating the time of the Min Pk Pk 2 horizontal bars indicating the Max and Min 2 vertical arrows indicating the time of the Max and Min Cycle RMS 3 horizontal bars indicating the High the Low and the RMS value 2 horizontal arrows facing each other at the mid ref indicating the cycle time Overshoot 3 horizontal ba...

Страница 418: ...rizontal bars indicating the high and low Pos Width 2 horizontal arrows facing each other at the mid ref indicating the start and end time In detailed mode there are 2 horizontal bars indicating the high and low Neg Width 2 horizontal arrows facing each other at the mid ref indicating the start and end time In detailed mode there are 2 horizontal bars indicating the high and low Period 2 horizonta...

Страница 419: ...e median bin Max 1 vertical or horizontal bar indicating the max bin Min 1 vertical or horizontal bar indicating the min bin Pk Pk 2 vertical or horizontal bars indicating the min and max bins Mean 1 vertical or horizontal bar indicating the mean bin Std Dev 3 vertical or horizontal bars indicating the mean and mean 1 standard deviation U 1 3 vertical or horizontal bars indicating the mean and mea...

Страница 420: ... vertical bars indicating the crossing times Crossing In Detailed mode 4 horizontal arrows and 2 horizontal bars indicating the eye window left right top and base 1 horizontal arrow indicating the crossing position In standard mode 1 horizontal arrow indicating the crossing position Eye Top 2 horizontal arrows and 1 horizontal bar indicating the eye window left the eye window right and the eye top...

Страница 421: ...and 2 horizontal bars indicating the eye window left right top and base S N Ratio 1 box indicating the histogram boundaries In detailed mode 4 horizontal arrows and 2 horizontal bars indicating the eye window left right top and base Cyc Distortion 2 horizontal arrows indicating the time of the rise time of the fall and the reference level In detailed mode 4 horizontal arrows and 2 horizontal bars ...

Страница 422: ...Appendix B Automatic Measurements Supported B 14 CSA7000 Series TDS7000 Series TDS6000 Series Instruments User Manual ...

Страница 423: ... Displays the Reference Setup window that you use to set up and control reference waveforms Displays the Waveform Display control window that you can use to turn the display of waveforms on and off Displays the control window that you use to position the waveform and set the vertical scale Displays a control window that you use to label your waveforms Displays the Reference Setup window that you u...

Страница 424: ...ette Color GrayScale or Black White View Full Screen or Graticules Only Image Normal or InkSaver Mode or Data Format used when exporting images Waveforms Select the Data Destination channel Source data range Waveform Detail and Data Ordering used when exporting waveforms Measurements Select the Data Format and type of Measurements used when exporting measurements Select for Export Full Screen bitm...

Страница 425: ...ll Screen bitmap Graticule bitmap Waveform data Measurement data Select from the list what you want to copy to the clipboard Copy Setup Displays the Copy Setup window that you use to set up and copy images waveforms and measurements Images Select the Palette Color GrayScale or Black White View Full Screen or Graticules Only Image Normal or InkSaver Mode or Data Format used when copying images Wave...

Страница 426: ...cal scale Label Displays a control window that you use to label your waveforms Vertical labels move if the waveform position changes also see display screen text on page C 9 Offset Displays the Vertical Offset control window you use to set the vertical offset and scale of a waveform Termination Displays the Termination control window you use to select input termination for a channel Coupling Displ...

Страница 427: ...ubmenu Function Horizontal Acquisition Setup Displays the Horizontal and Acquisition Setup window you use to set up the Horizontal and Vertical subsystems Horizontal You can set the record length scale resolution sample rate duration delay reference point and zoom Acquisition You can set the acquisition mode enable fast acquisitions roll mode equivalent time interpolated real time equivalent time ...

Страница 428: ...automatically uses equivalent time sampling when the sample rate is too fast to acquire enough samples using real time sampling Position Scale Displays the Horizontal control window that you use to turn on and off delay mode position the waveform and set the horizontal scale Resolution Displays the Resolution control window that you use to set the record length and view the duration sample rate an...

Страница 429: ...0 Displays the Zoom Display Area control window that you use to set the zoom graticule size Trigger Commands Table C 5 lists the commands available from the Trig menu on the menu bar Table C 5 Trig menu commands Menu Submenu Function A Event Main Trigger Setup Displays the Trigger Setup window you use to set up the A Event triggers Quick Select Edge Glitch Width Runt Timeout Transition Setup Hold ...

Страница 430: ... Setup Comm Setup optional on TDS7000 Series TDS6000 Series Serial Pattern Setup optional on TDS7000 Series TDS6000 Series A B Trigger Sequence B Event Delayed Trig ger Setup Holdoff Displays the trigger Holdoff control window you use to set trigger holdoff Mode Displays the Trigger Mode control window you can use to select the trigger mode force a trigger and set the trigger level to 50 Run Stop ...

Страница 431: ...gger level marker LCD backlight timeout and date and time display Colors Displays the Colors tab of the Display Setup window select the color of screen objects Display Style Dots Vectors Intensified Samples Choose Dots to display each waveform as a series of dots Choose Vectors to display vectors or lines between the dots Chose Intensified Samples to display actual samples as bright dots interpola...

Страница 432: ...and waveform database waveforms in shades of green Choose Gray to display fast acquisition and waveform database waveforms in shades of gray Choose Temp temperature to display fast acquisition and waveform database waveforms with the highest sample density points appearing in warmer colors reds Choose Spectral to display fast acquisition and waveform database waveforms with the highest sample dens...

Страница 433: ...s the Cursor Position control window that you use to position the cursors Cursor Setup Displays the Cursor Setup control window that you use to set up and control cursors Measure Commands Table C 8 lists the commands available from the Measure menu Table C 8 Measure menu commands Menu Submenu Function Measurement Setup Displays the Math Setup control window you use to display measurements setup me...

Страница 434: ...m More Area Cycle Area Phase Burst Width Displays the selected measurement of the selected waveform Statistics Reset Statistics Off Mean All Statistics Controls Resets measurement statistics Displays the selected measurement statistics of current measurements Displays the Statistics Controls window Reference Levels Displays the Reference Levels setup window you use to set the reference levels used...

Страница 435: ... Masks Commands Table C 9 lists the commands available from the Masks menu optional on TDS7000 Series TDS6000 Series on the menu bar Table C 9 Masks menu commands Menu Submenu Function Mask Setup Displays the Mask Setup window that you use to create mask waveforms Mask Type Displays the Type tab of the Mask Setup window that you use to select the type of mask Source Displays the Source tab of the ...

Страница 436: ...ath Commands Table C 10 lists the commands available from the Math menu on the menu bar Table C 10 Math menu commands Menu Submenu Function Math Setup Displays the Math Setup control window that you use to create math waveforms Display On Off Toggles the display of math waveforms on and off Position Scale Displays the vertical Position and Scale control window that you can use to change the vertic...

Страница 437: ...e Erases all setup and reference memory Set Time Date Displays a menu that you use to set the instrument date and time GPIB Configuration Displays a control window that you use to set the GPIB talk listen mode and the bus address LAN Server Status Displays the server status window that allows you to turn the server on and off External Signals Choose the source and polarity of the AUX OUT signal Ch...

Страница 438: ...o enable optional features and external applications 2 If error code 351 is displayed from the Utilities Instrument Calibration menu run Signal Path Compensation and then from the Utilities Instrument Diagnostics menu run the diagnostics Help Commands Table C 12 lists the commands available from the Help menu on the menu bar Table C 12 Help menu commands Menu Submenu Function Help on Window Displa...

Страница 439: ...or a soft bristle brush If any dirt remains use a cloth or swab dipped in a 75 isopropyl alcohol solution Use a swab to clean narrow spaces around controls and connectors Do not use abrasive compounds on any part of the chassis Clean the On Standby switch using a dampened cleaning towel Do not spray or wet the switch directly CAUTION Do not use chemical cleaning agents which might damage the plast...

Страница 440: ...l glass cleaners to clean the display Do not spray liquids directly on the display surface Do not scrub the display with excessive force Clean the flat panel display surface by gently rubbing the display with a clean room wipe such as Wypall Medium Duty Wipes 05701 available from Kimberly Clark Corporation If the display is very dirty moisten the wipe with distilled water or a 75 isopropyl alcohol...

Страница 441: ...divided by the record length Except in equivalent time the instrument acquires one data point for every acquisition interval Aliasing A false representation of a signal due to insufficient sampling of high frequencies or fast transitions A condition that occurs when an instrument digitizes at an effective sampling rate that is too slow to reproduce the input signal The waveform displayed on the in...

Страница 442: ...a specified time period Autoset A function of the instrument that automatically produces a stable waveform of usable size Autoset sets up front panel controls based on the characteristics of the active waveform A successful autoset will set the volts div time div and trigger level to produce a coherent and stable waveform display Average acquisition mode In this mode the instrument acquires and di...

Страница 443: ...f related controls for a major instrument function that the instrument displays at the right of the screen Coupling The association of two or more circuits or systems in such a way that power or information can be transferred from one to the other You can couple the input signal to the trigger and vertical systems several different ways Cursors Paired markers that you can use to make measurements ...

Страница 444: ...Po is the power out Pi is the power in and log is the decimal based logarithmic function See Optical Bandwidth on page 3 68 dBm A logarithmic measure of power referenced to 1 milliwatt 1 mW optical power 0 0 dBm dBm 10 log Ꮛoptical power 1 mW Ꮠ DC coupling A mode that passes both AC and DC signal components to the circuit Available for both the trigger system and the vertical system Delay measurem...

Страница 445: ...at the normal display rate using variable or infinite persistence This display mode emulates the display of an analog instrument Edge Trigger Triggering occurs when the instrument detects the source passing through a specified voltage level in a specified direction the trigger slope Envelope acquisition mode A mode in which the instrument acquires and displays a waveform that shows the variation e...

Страница 446: ...veform You define the area of interest using the vertical cursors Glitch positive trigger Triggering occurs if the instrument detects positive spike widths less than the specified glitch time Glitch negative trigger Triggering occurs if the instrument detects negative spike widths less than the specified glitch time Glitch either trigger Triggering occurs if the instrument detects either positive ...

Страница 447: ...stogram method With the min max method most useful for general waveforms it is the maximum value found With the histogram method most useful for pulses it refers to the most common value found above the mid point Holdoff trigger The time after a trigger signal that elapses before the trigger circuit will accept another trigger signal Trigger holdoff helps ensure a stable display Horizontal acquisi...

Страница 448: ...quired Sin x x computes record points in a curve fit between the actual values acquired It assumes all the interpolated points fall in their appropriate point in time on that curve Intensity Display brightness Interleaving A method by which instruments attain higher digitizing speeds The instrument applies the digitizing resources of unused channels that is channels that are turned off to sample t...

Страница 449: ...culated using either the min max or the histogram method With the min max method most useful for general waveforms it is the minimum value found With the histogram method most useful for pulses it refers to the most common value found below the mid point Maximum Amplitude voltage measurement of the maximum amplitude Typically the most positive peak voltage Mean Amplitude voltage measurement of the...

Страница 450: ...ition of oscillation in a laser A laser can operate in one mode single mode or in many modes multimode Multimode Cable A thick cored optical fiber compared to single mode cable that can propagate light of multiple modes Multipurpose knobs Front panel knobs you can use to change the value of the assigned parameter NAND A logic Boolean function in which the output of the AND function is complemented...

Страница 451: ...ate function Optical to Electrical converter A device that converts an optical signal to an electrical signal OR A logic Boolean function in which the output is true if any of the inputs are true Otherwise the output is false On the instrument a trigger logic pattern and state function Peak Detect acquisition mode A mode in which the instrument saves the minimum and maximum samples over two adjace...

Страница 452: ...splay The instrument display is 640 pixels wide by 480 pixels high Positive duty cycle A timing measurement of the ratio of the positive pulse width to the signal period expressed as a percentage Positive overshoot Amplitude voltage measurement PositiveOvershoot Max High Amplitude 100 Positive width A timing measurement of the distance time between two amplitude points rising edge MidRef default 5...

Страница 453: ...ampled such as a voltage to a digital value Real time sampling A sampling mode where the instrument samples fast enough to completely fill a waveform record from a single trigger event Use real time sampling to capture single shot or transient events Record length The specified number of samples in a waveform Recovered Clock A clock signal derived from and synchronous with a received data sequence...

Страница 454: ...cquisition Sample interval The time interval between successive samples in a time base For real time digitizers the sample interval is the reciprocal of the sample rate For equivalent time digitizers the time interval between successive samples represents equivalent time not real time Sampling The process of capturing an analog input such as a voltage at a discrete point in time and holding it con...

Страница 455: ...gle mode is propagated Slew Rate trigger A mode in which the instrument triggers based on how fast a pulse edge traverses slews between an upper and lower threshold The edge of the pulse may be positive negative or either The instrument can trigger on slew rates faster or slower than a user specified rate Slope The direction at a point on a waveform You can calculate the direction by computing the...

Страница 456: ...definition of what the trace displays It can include one or more channels combined arithmetically and modified by functions Trigger An event that marks time zero in the waveform record It results in acquisi tion and display of the waveform Trigger level The vertical level the trigger signal must cross to generate a trigger on edge trigger mode Vertical acquisition window The vertical range of the ...

Страница 457: ...m point has been acquired Waveform interval The time interval between record points as displayed XY format A display format that compares the voltage level of two waveform records point by point It is useful for studying phase relationships between two waveforms XYZ format A display format that compares the voltage level of two waveform records point by point as in XY format The displayed waveform...

Страница 458: ...Glossary Glossary 18 CSA7000 Series TDS7000 Series TDS6000 Series Instruments User Manual ...

Страница 459: ...3 102 3 121 NOR 3 106 3 109 OR 3 106 3 109 pattern 3 106 polarity and width 3 94 3 96 3 100 positive 3 94 3 96 3 100 3 102 3 121 pulse 3 94 3 96 3 99 3 101 3 104 rising edge 3 109 3 111 runt 3 96 set thresholds 3 106 3 109 set to ECL 3 102 set to TTL 3 102 setup hold 3 110 slew rate 3 101 source 3 94 3 96 3 99 3 101 3 104 state 3 109 thresholds 3 98 3 102 timeout 3 104 3 105 timer 3 105 transition...

Страница 460: ...3 37 to stop acquiring 3 37 to take a single acquisition 3 37 to turn off roll mode acquisitions 3 39 trigger point 3 41 untriggered roll 3 32 untriggered roll with single sequence 3 32 using 3 28 using fast acquisition mode 3 47 using FastFrame 3 56 waveform database 3 30 3 35 waveform record 3 41 Acquisition mode C 6 spectral math 3 227 Acquisition modes incompatible with fast acquisitions 3 47 ...

Страница 461: ... Glossary 8 Glossary 13 readout 3 136 trigger input 3 73 3 80 Channel 3 150 Channel configuration 3 40 Channel reference indicator Glossary 3 Channel probe deskew 3 181 Glossary 3 Channels deskew 3 181 digitizer configuration 3 40 shared horizontal window 3 26 shared parameters illustrated 3 26 Circuit loading Glossary 3 Cleaning exterior D 1 flat panel display D 2 Cleaning optical connectors 3 66...

Страница 462: ...ry 3 Cycle RMS B 1 C 11 Glossary 3 D DATA 3 64 Data controlling input and output 3 245 Data input output 3 245 all settings are retained 3 246 avoiding setup waveform mismatches 3 247 begin your chart 3 272 bitmap file format 3 262 copy your file 3 276 copying waveforms 3 262 delete a reference waveform file 3 260 delete the file 3 261 delete the reference 3 260 display the reference control windo...

Страница 463: ...setup 3 251 to recall your waveform 3 257 to save to a file 3 249 to save your setup 3 248 to save your waveform 3 254 to set the date and time 3 281 to set up the page 3 278 to use an exported waveform 3 271 using auto increment filename 3 247 view 3 278 Data Source A Trigger control window 3 111 Date and time display 3 140 C 10 displaying 3 281 set 3 140 setting 3 281 Date time on hardcopies 3 2...

Страница 464: ...he horizontal reference 3 130 backlight timeout 3 140 change graticule style 3 144 change waveforms colors 3 144 checking the zoom scale and position 3 136 color palette 3 139 customizable display elements 3 138 customize graticule waveforms 3 144 customizing the display 3 138 date and time 3 140 defining and displaying waveforms 3 126 display and acquisition controls 3 128 display control 3 125 d...

Страница 465: ...40 yt 3 140 zoom 3 125 3 127 3 131 zoom a waveform 3 134 zoom position 3 136 zoom reset 3 136 3 137 zoom scale 3 136 Dots 3 138 3 140 3 142 C 9 display control window 3 140 DPO Glossary 5 Dragging Glossary 5 Dual display setup 1 17 Dual graticule Glossary 5 Duration 3 204 Duty cycle Glossary 10 Glossary 12 Duty cycle distortion B 5 E ECL 3 95 3 102 3 105 3 111 A Trigger level 3 85 3 86 Edge setup ...

Страница 466: ...the reference position frames 3 62 to set FastFrame mode 3 58 turn readouts on or off time stamps 3 60 using FastFrame acquisitions 3 57 view multiple frames 3 59 FastFrame mode using 3 58 FastFrame setup horizontal menu 3 58 3 62 FFT math waveform automated measurements of 3 229 phase suppression 3 234 procedure for displaying 3 231 procedure for measuring 3 229 3 238 Fiber optics Glossary 6 File...

Страница 467: ...ck C 16 help on window C 16 restore help C 16 specifications C 16 technical support C 16 Help on window C 16 Hi Res 3 28 acquisition mode Glossary 7 incompatible with fast acquisitions 3 47 High B 1 Glossary 7 High level C 11 High low method 3 151 Histogram 3 157 limit controls 3 171 Histogram counting resetting 3 169 starting 3 169 Histogram mean 3 157 Histogram measurements C 13 Histogram setup ...

Страница 468: ... 3 193 applications 3 193 derivation of 3 193 record length of 3 193 Integration waveform 3 192 Inten samp 3 142 Intensified samples 3 142 C 9 Intensity 3 53 Glossary 8 display menu 3 53 Waveform 3 139 Interleaving 3 46 Glossary 8 Internal reference 2 11 C 15 Interpolated real time C 6 Interpolation 3 45 3 46 3 139 3 141 C 9 Glossary 8 incompatible with DPO 3 47 Introduction to this manual xv J Ji...

Страница 469: ...ectral Math derivative See Derivative math waveform derivative math waveform illustration 3 191 differentiation 3 190 disallowed in DPO 3 47 display the math control window 3 194 expression syntax 3 189 FastFrame 3 187 functional transformation of an acquired waveform illustration 3 186 how to create 3 188 how to manage displaying 3 197 incompatible with fast acquisitions 3 47 integral See Integra...

Страница 470: ... 12 snapshot C 11 standard deviation C 13 statistics C 12 statistics controls C 12 time C 12 value count C 13 value mean C 12 waveform histograms C 12 Measurement C 3 Glossary 9 amplitude B 1 Glossary 1 area B 1 Glossary 2 burst width B 1 Glossary 2 crossing B 4 cycle area B 1 Glossary 3 cycle mean B 1 Glossary 3 cycle RMS B 1 Glossary 3 delay Glossary 4 duty cycle Glossary 10 Glossary 12 duty cyc...

Страница 471: ...endently 3 163 customize measurements 3 149 display measurement statistics 3 155 display the calibration instructions 3 172 display the cursor controls window 3 166 enable position the gates 3 160 FastFrame 3 150 gates 3 150 gating 3 159 graticule cursor and automatic measurements 3 148 high low method 3 151 histogram 3 151 3 157 histogram counting 3 169 histogram counting stays on 3 169 histogram...

Страница 472: ... 146 See also Zoom feature 3 131 N NAND Glossary 10 NAND A Trigger control window 3 106 3 109 Neg duty cycle C 12 Neg overshoot C 11 Negative duty cycle B 2 Negative overshoot B 2 Negative width B 2 C 12 Negative A Trigger control window 3 94 3 96 3 100 3 102 3 121 Net offset A 8 Network connection 1 15 No persistence C 9 Noise reducing in phase FFTs 3 234 reducing in phase waveforms 3 213 Noise p...

Страница 473: ...3 121 Posttrigger 3 73 Glossary 12 Powering off 1 10 Powering on 1 9 Preferences C 16 Pretrigger 3 73 Glossary 12 Principal power switch Glossary 12 Print C 2 Print preview 3 280 C 2 Printing 3 277 waveforms 3 277 Probe accessories 1 41 cal C 4 calibrate 3 177 calibration fixture 3 173 compensate timing 3 182 3 183 compensation Glossary 13 definition Glossary 13 low frequency compensation 3 180 Pr...

Страница 474: ...nt trigger 3 89 C 7 Glossary 14 A Trigger control window 3 96 how to set up 3 96 3 122 S S N ratio B 5 C 12 Sample 3 28 3 35 Sample acquisition mode Glossary 14 Sample interval 3 24 Glossary 14 defined 3 41 Sample rate maximum 3 46 Samples number of 3 31 Sampling 3 42 Glossary 14 process defined 3 40 process illustrated 3 40 3 46 Sampling and acquisition mode 3 43 Sampling modes C 6 Save format ex...

Страница 475: ...playing phase 3 234 Spectral analyzer controls 3 236 Spectral averaging 3 203 Spectral controls C 15 Spectral grading C 10 Spectral Math reference level 3 210 Spectral math 3 dB BW in bins 3 216 acquisition mode 3 227 affects of frequency domain control adjustments illustrated 3 209 affects of trigger jitter 3 227 aliasing 3 227 averaging 3 227 bandwidth 3 236 Blackman Harris 3 214 3 216 3 222 3 2...

Страница 476: ...phs for the Rectangu lar window illustration 3 220 time and frequency graphs for the Gaussian Window illustration 3 219 time and frequency graphs for the Hanning window illustration 3 222 time and frequency graphs for the Kaiser Bessel window illustration 3 223 time and frequency graphs of the Blackman Harris window illustration 3 224 time and frequency graphs of the Hamming window 3 221 time doma...

Страница 477: ...control window 3 119 Trigger 3 72 Glossary 16 A Only 3 118 AC line voltage 3 73 3 80 auxiliary 3 73 3 80 coupling 3 76 delay 3 78 edge 3 73 Glossary 5 glitch 3 89 3 94 Glossary 6 holdoff 3 75 level 3 77 Glossary 16 line 3 73 3 80 logic 3 88 3 91 Marker 3 140 mode 3 74 pattern 3 90 3 106 position 3 77 pulse 3 88 readout 3 82 runt 3 89 3 96 Glossary 14 setup hold 3 92 3 110 slew rate 3 90 Glossary 1...

Страница 478: ...and hold times 3 112 set the thresholds 3 98 set the timer 3 105 set the transition time 3 102 set thresholds 3 109 set to trigger if width 3 95 set to trigger when 3 97 3 100 3 103 3 104 set trigger when 3 110 setup hold trigger 3 92 slope and level 3 77 state trigger 3 91 the trigger event 3 73 timeout trigger 3 90 to check trigger status 3 82 to define a time qualified pattern trigger 3 108 to ...

Страница 479: ...er preferences C 16 V Value count C 13 Value mean C 12 Variable persistence 3 142 3 143 C 9 display control window 3 140 Variable persistence display control window 3 140 Varying vertical offset 3 23 V bars C 11 Vectors 3 138 3 140 C 9 display control window 3 140 Vectors display incompatible with DPO 3 47 Verification incoming inspection procedure 1 21 Version number C 16 Vertical acquisition win...

Страница 480: ...ry 11 Glossary 12 setup C 8 trigger C 7 Width trigger 3 89 3 99 A Trigger control window 3 99 how to set up 3 99 3 122 main trigger menu 3 94 3 97 Window 3 214 Blackman Harris 3 235 characteristics 3 216 characteristics of 3 214 Flattop2 3 235 functions 3 202 Gaussian 3 235 Hamming 3 235 Hanning 3 235 Kaiser Bessel 3 235 rectangular 3 235 rectangular vs bell shaped 3 220 selecting 3 216 Tek Expone...

Отзывы: