background image

60

Scan Module Operation

Troubleshooting

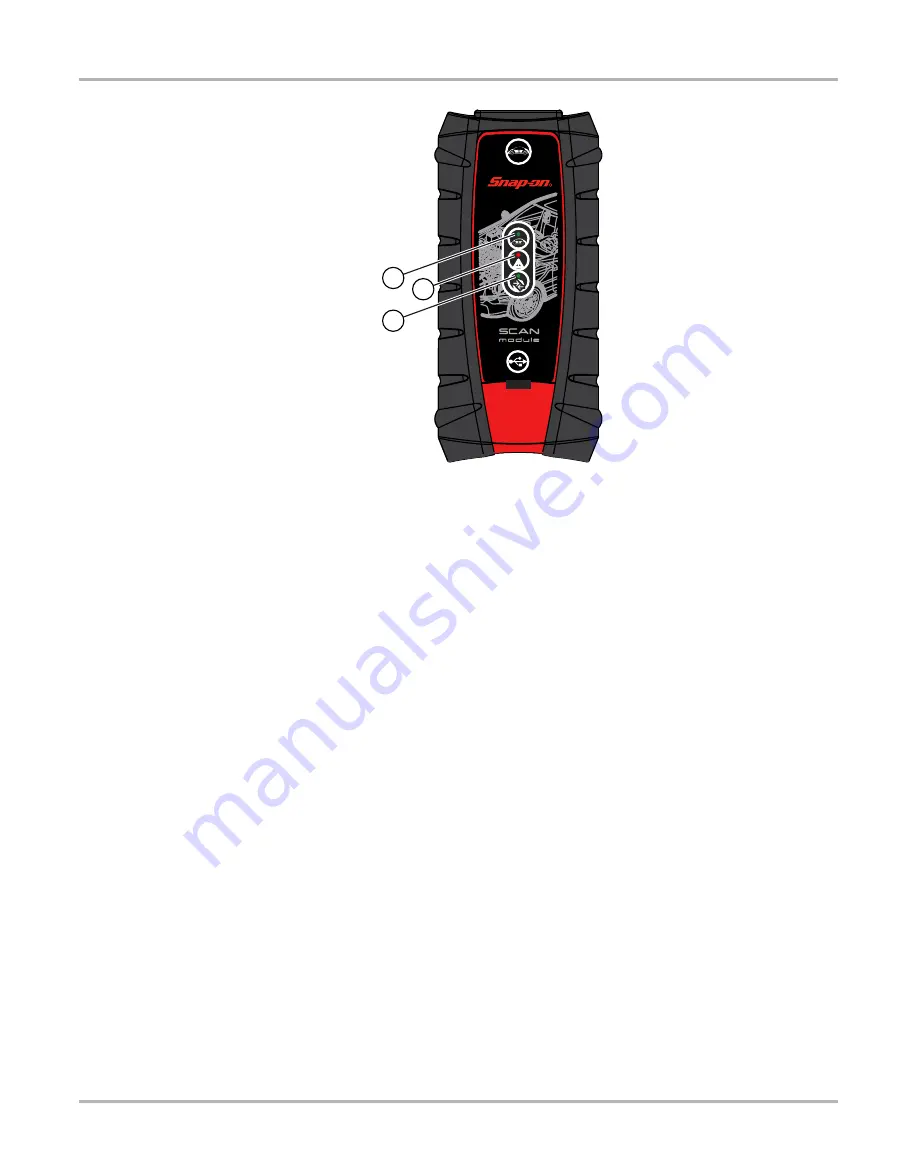
1— Vehicle Power—green LED, flashes during wireless communications
2— Communication—red LED, illuminates if there is a communications failure
3— Bluetooth—green LED, flashes during wireless communications

Figure 5-6 

Scan Module LEDs

Each LED can be in one of three states; off, lit solid, or flashing. Interpret as follows:

Vehicle Power

Off, vehicle power is not being supplied to the Scan Module through the data cable

On Solid, the Scan Module is being powered by the vehicle, but not communicating with 
the Diagnostic Tool.

Flashing, the Scan Module is being powered by the vehicle and is communicating with the 
Diagnostic Tool.

Communication

Off, normal state, no errors detected.

On Solid, communications error detected.

Flashing, internal self-test in process, will go out once the test completes.

Bluetooth

Off, there is no connection between the Scan Module and Diagnostic Tool.

On Solid, the Scan Module and Diagnostic Tool are communicating through a solid 
(USB cable) connection.

Flashing, the Scan Module and Diagnostic Tool are communicating through a wireless 
connection.

($//%

5

Содержание VERUS

Страница 1: ...User Manual EAZ0061B58A Rev E ...

Страница 2: ...e or rental agreement under the terms of which the equipment to which this manual relates was acquired Increases in any way the liability to the customer or to third parties Snap on reserves the right to make changes at any time without notice IMPORTANT Before operating or maintaining this unit please read this manual carefully paying extra attention to the safety warnings and precautions Manuals ...

Страница 3: ...tance Phone E mail 44 0 845 601 4736 diagnosticsUKproductsupport snapon com For technical assistance in all other markets contact your selling agent Regulatory Information This product has been tested to the requirements of CAN CSA C22 2 No 61010 1 second edition including Amendment 1 or a later version of the same standard incorporating the same level of testing requirements ...

Страница 4: ...iv ...

Страница 5: ... variations in the products that can be tested with this instrument we cannot possibly anticipate or provide advice or safety messages to cover every situation It is the responsibility of the automotive technician to be knowledgeable of the system being tested It is essential to use proper service methods and test procedures It is important to perform tests in an appropriate and acceptable manner ...

Страница 6: ...rate or minor injury to the operator or to bystanders Safety Message Conventions Safety messages are provided to help prevent personal injury and equipment damage Safety messages communicate the hazard hazard avoidance and possible consequences using three different type styles Normal type states the hazard Bold type states how to avoid the hazard Italic type states the possible consequences of no...

Страница 7: ...servation 8 Power Sources 8 Scan Module Wireless 10 Functional Description 10 Technical Specifications 11 Power Sources 11 Chapter 3 Basic Operation and Navigation 12 Turning On Off and Emergency Shutdown 12 Turning On 12 Turning Off 12 Emergency Shutdown 12 Controls and Indicators 13 Control Buttons 13 LEDs 13 Basic Navigation 14 Starting the ShopStream Diagnostic Suite Program 14 Home Screen Lay...

Страница 8: ... Checking Hardware Status 59 Recovery Procedure 61 Updating Scan Module Firmware 63 Chapter 6 OBD Direct Operations 67 OBD Health Check 68 Global OBD II Code Check 68 Global OBD II Clear Codes 69 Readiness Monitors 69 MIL Status 70 OBD Diagnose 70 Start Communication 70 Connector Information 74 Manual Protocol Selection 74 Chapter 7 Guided Component Test Operations 75 Vehicle Identification 75 Men...

Страница 9: ...nt Locations 119 Wiring Diagrams 121 Toolbar 121 Component Selection Menu 122 Full width Window 122 Magnified Window 122 Chapter 10 Vehicle History Operations 123 Screen Layout 123 Vehicle History Main Body Records List 123 Vehicle History Toolbar 124 Chapter 11 Data Manager Operations 129 Screen Layout 129 Navigation 130 Operations 131 My Data 131 Up 131 Open 131 New 132 Delete 133 Rename 134 Pro...

Страница 10: ...shboard Feature Information 162 Chapter 15 ShopStream Update Tool SST 165 Basic Operation 165 Manual Software Download 167 Installing Software Updates 169 Installing Software Upgrades 171 Chapter 16 Maintenance 173 Cleaning the Touch Screen 173 Calibrating the Touch Screen 173 Cleaning and Inspecting the Diagnostic Tool 174 Fan Filter Service 174 Battery Pack Service 175 Battery Pack Safety Guidel...

Страница 11: ... items such as buttons and menu options Example Select Functions 1 1 2 Symbols The greater than arrow indicates an abbreviated set of selection instructions Example Select Utilities Tool Setup Date The above statement abbreviates the following procedure 1 Select the Utilities icon 2 Select the Tool Setup submenu 3 Highlight the Date option from the submenu 1 1 3 Terminology The term select describ...

Страница 12: ...ommunication can cause damage to the ECM 1 1 5 Procedures An arrow icon indicates a procedure Example z To change screen views 1 Select View The dropdown menu displays 2 Select an option from the menu The screen layout changes to the format you selected 1 1 6 Hyperlinks Hyperlinks or links that take you to other related articles procedures and illustrations are available in electronic documents Bl...

Страница 13: ...devices and how they work together to deliver diagnostic solutions There are two versions of the VERUS Diagnostic Tool operation and function are similar for both Standard Version On early model VERUS Diagnostic Tools the Scanner is built integrated into the Diagnostic Tool During scanner testing the data cable is connected directly from the Diagnostic Tool to the data link connector on the vehicl...

Страница 14: ...stic Tool 1 Audio Speaker 2 Touch Screen Display 3 Microphone 4 S Shortcut Button 5 Virtual Keyboard Button 6 Brightness Up Button 7 Brightness Down Button 8 Hard Drive Activity LED 9 Wireless LAN Activity LED 10 Battery Charging LED 11 Main Power LED 12 Power Button Figure 2 1 Front view ...

Страница 15: ...or 2 LAN local area network Jack 3 USB universal serial bus Jack 4 Audio head phone Jack 5 DC Power Supply Input Jack 6 Fan Filter 7 Data Cable Connector 8 Scope Auxiliary Connector 9 Channel 4 Jack 10 Channel 3 Jack 11 Channel 2 Jack 12 Channel 1 Jack 13 Common Ground Jack Figure 2 2 Top view standard model ...

Страница 16: ...ay Connector 2 LAN local area network Jack 3 USB universal serial bus Jacks 2 4 Audio head phone Jack 5 DC Power Supply Input Jack 6 Fan Filter 7 Scope Auxiliary Connector 8 Channel 4 Jack 9 Channel 3 Jack 10 Channel 2 Jack 11 Channel 1 Jack 12 Common Ground Jack Figure 2 3 Top view wireless model ...

Страница 17: ... inch outdoor enhanced TFT LCD 1024 x 768 resolution 262 144 Colors Processor Standard 600MHz Intel Celeron M WIreless Intel Atom 1 6GHz Operating System Microsoft Windows Embedded Standard XPe SP3 Communications 802 11 b g n Wireless Wireless Bluetooth 2 0 Technology 10 100 Ethernet Jack Memory Standard 500MB RAM Wireless 1GB RAM Battery Lithium Ion Smart Battery Pack Approximate 4 hour run time ...

Страница 18: ...an be configured by selecting Power Options from the Windows Control Panel menu 2 1 6 Power Sources Your Diagnostic Tool can receive power from any of the following sources Internal Battery Pack Docking Station Optional AC DC Power Supply Vehicle Power Internal Battery Pack The Diagnostic Tool can be powered from a rechargeable lithium ion battery located on the bottom of the Diagnostic Tool under...

Страница 19: ...herals Contact your sale representative for additional details AC DC Power Supply The Diagnostic Tool can be powered from a wall socket using the AC DC power supply and power cord The AC DC power supply also powers the internal battery pack charging process Vehicle Power The standard Diagnostic Tool can be powered through the DLC when connected to an OBD II vehicle with the data cable However batt...

Страница 20: ...3 Bluetooth LED green 4 Communication issue LED red 5 Vehicle power LED green 6 Universal serial bus USB jack remove protective hand grip for access Figure 2 5 Scan Module Wireless Communication The wireless Scan Module is a communication device that transmits vehicle data to the Diagnostic Tool without a physical connection The working range of the transmitter is about 30 feet 9 14 m A signal los...

Страница 21: ...er cable supplied with your kit Item Description Specification Communications Wireless Bluetooth 2 0 Technology USB Power 5V 500mA Data Cable Connector Power 8V to 32V Maximum 12 Watts Width 8 04 in 204 3 mm Height 3 82 in 97 mm Depth 1 66 in 42 1 mm Weight 0 9 lb 0 408 kg Operating Temperature Range ambient At 0 to 90 relative humidity non condensing 32 to 113 F 0 to 45 C Storage Temperature ambi...

Страница 22: ...ing down the diagnostic tool A warning message displays if you attempt to shut down while the diagnostic tool is communicating with a vehicle Forcing a shut down while communicating may lead to ECM problems on some vehicles Exit the Scanner function before turning off Before turning the diagnostic tool off it is highly recommended to back up personal and saved data to a USB mass storage device on ...

Страница 23: ... single button press This screen capture function is available at all times even when operating outside of the VERUS diagnostic tool software 3 2 2 LEDs The four light emitting diodes indicate certain system conditions Hard Drive Activity LED illuminates when the central processing unit CPU is reading or writing to the hard disk drive HDD Wireless LAN Activity LED illuminates when a wireless local...

Страница 24: ...an be minimized resized and closed like any other Windows program To access the Windows desktop minimize the program window If the program is exited or closed select the ShopStream Diagnostic Suite icon from the Windows desktop to start the program Figure 3 1 ShopStream Diagnostic Suite desktop icon NOTE i The ShopStream Diagnostic Suite can also be started from the Windows Start menu 3 3 2 Home S...

Страница 25: ...ied vehicle See Guided Component Test Operations on page 75 Scope Multimeter Configures the diagnostic tool to operate as a lab scope graphing multimeter or digital multimeter See Scope Multimeter on page 86 Information Provides the information needed to make repairs once you have made your diagnosis The linked program varies by region See Information on page 111 Vehicle History Identifies the tes...

Страница 26: ...PDF copy of the Important Safety Instructions that are included in your diagnostic tool kit The Important Safety Instructions document should be read and understood prior to using the diagnostic tool Help A variety of utilities and additional resources are available through the Help menu Basic menu options which are available for all modules include User Manual Version Info Activation Status Table...

Страница 27: ...ic tool is a fully functional personal computer based on the Windows Embedded Standard operating system Refer to Microsoft documentation for additional information Windows System Tray ShopStream Diagnostic Suite Programs The Windows system tray may contain standard Windows application icons e g Wireless Network Connection Status Audio volume etc and specialized application icons designed for use o...

Страница 28: ...con in the Windows system tray opens the Virtual Keyboard menu Menu options include Hide Virtual Keyboard minimizes the keyboard Close Virtual Keyboard closes the Virtual Keyboard program Show Virtual Keyboard displays the keyboard Settings opens the Virtual Keyboard settings window Figure 3 5 About displays the Virtual Keyboard program software version number Virtual Keyboard program selection fr...

Страница 29: ...anded NOTE i The Virtual Keyboard can be set to open automatically when a data field or form is selected in certain applications See the Settings window Figure 3 5 for selection options Figure 3 5 Virtual Keyboard settings window 3 5 Wi Fi Setup Certain applications in the ShopStream Diagnostic Suite require wireless Internet connection The wireless network connection status icon is typically avai...

Страница 30: ...anner function can access the electronic control module ECM for various vehicle control systems such as engine transmission antilock brake system ABS and more Scanner and OBD II testing requires connecting the Diagnostic Tool to the test vehicle using the data cable and test adapters and or Scan Module depending on version Onscreen data cable connection instructions are provided Additional connect...

Страница 31: ... basic menus controls and navigation of the Scanner function and select scanner tests 4 2 1 Screen Messages Screen messages appear when additional input is needed before proceeding There are three types of on screen messages confirmations warnings and errors Confirmation Messages Confirmation messages inform you when you are about to perform an action that cannot be reversed or when an action has ...

Страница 32: ...at a time As you select from a menu the next menu in the series displays Each selection narrows the focus and leads to the desired test Use your fingertip or the stylus to make menu selections 4 2 3 Scanner Screen Layout The Scanner screens typically include three sections Figure 4 2 1 Scanner Toolbar 2 Main Body 3 Lower Toolbar Figure 4 2 Scanner screen layout ...

Страница 33: ...Allows you to select which parameters are displayed on the screen Alarms Allows you to set an alarm on certain data parameters when the signal goes above or below the alarm setting Properties Allows you to adjust the display characteristics for all of the data screens Graph View Allows you to simultaneously view up to 16 data graphs at a time Save Saves a copy of the current frame of data that can...

Страница 34: ...lear the highlights from the screen 3 Create a custom data list by selecting the parameters to be included Highlighting indicates a parameter that displays parameters that are not highlighted do not display Figure 4 3 Sample custom configuration screen Keep the following in mind when configuring a custom data list Gesture scroll if the list of parameters is longer than what is shown on the screen ...

Страница 35: ...s off Only digital parameters those with a range limited to two states can have alarms Parameters with continuous ranges such as variable voltage and pressure values cannot have alarms The alarm indicator assignments remain as selected until you exit the data list z To configure alarm settings 1 Select the Alarms icon on the Scanner Toolbar The Alarm List dialog box opens 2 Check the parameters th...

Страница 36: ... Grid icon is used to switch a background grid pattern on the data graphs on and off To switch the grid on select to highlight Show Grid then select Accept To switch the grid off select Show Grid twice so it is not highlighted then select Accept The Samples After Trigger setting determines how many data samples are recorded following a triggering event The highlighted samples icon indicates the nu...

Страница 37: ...t View The Data Buffer toolbar at the base of the screen remains active NOTE i The screen does not scroll in Graph View mode it adjusts to show only the selected parameters Figure 4 6 Sample Graph View screen Graph View mode can also be engaged from the custom data list configuration screen Refer to Custom on page 24 for details z To use Graph View 1 Open the graph for each data parameter up to si...

Страница 38: ...og box displays while data is being saved The movie is saved when the message box disappears Figure 4 7 Sample save dialog box Saved files can later be viewed by selecting Data Manager on the home screen From the Data Manger open the Scanner Data Folder then locate and select the saved file to be viewed Print Selecting Print from the toolbar opens a standard Windows Print dialog box Select from th...

Страница 39: ...an internet browser z To open a saved print file 1 Minimize the Diagnostic Suite to view the desktop 2 From the desktop select My Documents ShopStream Scanner Data Folder 3 Locate the file you wish to view 4 Double tap the file to open it The internet browser and file open More Whenever the More icon appears on the toolbar it indicates that there are additional options available Selecting the More...

Страница 40: ...ng information controls and other diagnostic information Lower Toolbar Whenever communication is established with a vehicle the Scanner continuously records data transmitted by the ECM in the data buffer The toolbar below the main body of the screen contains the icons for navigating the buffered data Table 4 2 Table 4 2 Data buffer toolbar icons sheet 1 of 2 Name Icon Description Snapshot Arms the...

Страница 41: ...r Erases data in the data buffer Step Back Moves to the previous frame in the data buffer Frame Counter Indicates the data buffer frame currently displayed Step Forward Moves to the next frame in the data buffer Zoom In Increases the magnification by decreasing the sweep of the graph Zoom Out Decreases the magnification by increasing the sweep of the graph Table 4 2 Data buffer toolbar icons sheet...

Страница 42: ...save a copy of the data currently being viewed Menu options include Save opens a submenu with these options Screenshot saves a graphic image of the current screen Collected Data saves a recording of all the data currently in the buffer plus the number of frames designated after the trigger event see Properties on page 26 Print opens a submenu with these options Screen sends the current screen imag...

Страница 43: ... to select the desired value for each item 3 Select Accept to close the dialog box and apply the changes Display BEN Selecting opens a screen with the Balco Engine Number BEN of the currently identified vehicle The BEN is used internally for data coordination and you may be asked to provide to a Customer Care representative for troubleshooting communication problems Help A variety of utilities and...

Страница 44: ...ormation to a document or e mail 4 3 Scanner Operation Before initial use the Scan Module must be paired with the Diagnostic Tool to establish a wireless communication link Refer to Pairing The Scan Module on page 55 for details Both the Scan Module and the Diagnostic Tool must be powered on The Scanner function has two main operation features Scanner allows communication with the vehicle ECMs to ...

Страница 45: ...ts and make a series of choices Each selection advances to the next screen A Back icon in the upper left corner of the screen returns to the previous screen Procedures vary by vehicle z To identify a vehicle for Scanner testing 1 Select the Scanner Function icon from the Home screen A list of manufacturers displays Figure 4 15 Figure 4 15 Sample manufacturer list 2 Select the manufacturer of the t...

Страница 46: ...DII EOBD allows you to perform generic OBD II or EOBD tests see OBD Direct Operations on page 67 for additional information 4 3 2 Connecting to a Vehicle Data Cable Connection standard version Connection of the data cable to the Diagnostic Tool and vehicle DLC is required for Scanner and OBD II EOBD testing Depending on the vehicle the supplied DA 4 data cable may be used alone or may require opti...

Страница 47: ...he vehicle Figure 4 17 2 Select Continue once the data cable is connected The Diagnostic Tool establishes communication then displays a list of available tests If the Diagnostic Tool is unable to establish a communications link a no communications message displays 3 Select from the available tests to open a submenu of test options No Communication Message When the screen displays a no communicatio...

Страница 48: ...with the Diagnostic Tool If the Scanner tries to communicate with the vehicle and the Scan Module is not connected to the vehicle a Connect Data Cable confirmation screen will display For Scan Module connection and operation information see Pairing The Scan Module on page 55 4 3 3 Vehicle System Selection z Selecting a vehicle system 1 After the vehicle has been identified a list of available syst...

Страница 49: ...gressively as the modules are scanned The total number of systems detected A summarized list of modules detected with DTCs totals for each Individual system module reports that include a list of the DTCs set the DTC common replaced parts graph and a direct link to SureTrack Fix It information for each specific DTC For additional information on SureTrack the Fix It and common replaced parts graph f...

Страница 50: ...er Operation Figure 4 20 Code Scan Features 1 SureTrack Common Replaced Parts Graph 2 Code Scan Summary 3 Progressive status indicator 4 Systems Summary List with DTC totals 5 Individual System DTC Reports 6 SureTrack Fix It icon ...

Страница 51: ...41 Scanner Operations Scanner Operation Select Print from the toolbar to print the Code Summary Report Figure 4 21 Printed Code Summary Report ...

Страница 52: ...m the ECM This selection is found on a Codes submenu for some models Functional Tests provides specific subsystem and Guided Component Tests The tests vary depending on the manufacturer and model Actuator Tests similar to functional tests checks the operation of certain actuators such as solenoid valves and relays Memory Resets allows you to reprogram adaptive values for certain components after m...

Страница 53: ...selected module The items available for any electronic control module vary from one vehicle to another Data is presented in a 2 column format An abbreviated parameter name is at the left of each column and its value is at the right edge of the column Parameters display in the order that they are transmitted by the ECM so expect variation between vehicles Gesture scrolling allows you to quickly mov...

Страница 54: ...he buffered information is automatically saved as a movie This gives you a complete picture of what was happening before the fact what occurred at the trigger point and what happened after the fact Data collection is paused following a trigger event Select the Play icon to resume viewing live data A vertical line now appears on each of the data graphs to indicate the triggering point The trigger l...

Страница 55: ...alog box select Triggers On A check mark appears in the box and the Min and Max fields activate Figure 4 25 3 Select either Max maximum or Min minimum to activate that field and open the keyboard 4 Type the desired trigger value into the field 5 Select the other field and enter a trigger value then close the virtual keyboard 6 Select Save to close the dialog box Trigger lines blue for upper and re...

Страница 56: ...s are available auto scale and manual scale Auto scale which is the default setting automatically adjusts the graph scale based upon the minimum and maximum values transmitted by the ECM Manual scale allows you to set the minimum and maximum values z To manually set the scale on a graph 1 Select the Graph Properties icon to open the dialog box for the graph you wish to scale 2 From the Graph Prope...

Страница 57: ... Submenu options may include Trouble Code Information opens a list of codes in ECM memory History Codes opens a list of codes whose symptoms are not currently present History codes indicate an intermittently occurring problem Failed This Ignition opens a list of codes that set during the current ignition cycle MIL SVS or Message Requested displays ECM requests to light the malfunction indicator la...

Страница 58: ...unction is not available on the test vehicle Clear Codes does not appear as a menu option z To clear codes 1 Select Clear Codes from the Codes Menu A confirmation message displays 2 Make sure any conditions shown on the confirmation message are met then select Yes A codes cleared message displays once the operation is complete 3 Select Continue to return to the Codes Menu Freeze Frame Failure Reco...

Страница 59: ...re 4 30 2 Use the virtual keyboard to enter the characters of the DTC 3 Select the virtual keyboard Backspace icon if needed to erase a character 4 Select the virtual keyboard Return key once all the code characters are entered Figure 4 30 Sample DTC Status entry field The DTC status report displays Figure 4 31 Figure 4 31 Sample DTC status report 5 Select Exit to return to the DTC status entry sc...

Страница 60: ...duty cycle in 10 increments Reset Tests reset the adaptive or learned values that are stored in the electronic control module Selecting Functional Tests opens a menu of test options that varies by make and model Selecting a menu option either activates the test or opens a submenu of additional choices Follow all screen instructions while performing tests How and what information is presented on th...

Страница 61: ...ication numbers 09 Calibration Verification Number displays the ECM calibration 09 In Use Performance Tracking displays a monitoring conditions report 09 Vehicle Identification Number displays the VIN 0A Emissions Related Fault with Permanent Status displays a record of permanent codes Troubleshooter Fast Track Troubleshooter is a database of experience based information of validated real world re...

Страница 62: ...ienced on vehicles of the same model Tests and Procedures explains how to perform certain tests on the specific test vehicle Some tips provide specifications and installation information as well Fast Track Data Scan Normal Values contains information and guidelines on how to validate data readings for certain sensors and actuators live data values are provided NOTE i Troubleshooter appears in a Sc...

Страница 63: ... turning off the tool z To exit Scanner and disconnect from a vehicle When disconnecting the Diagnostic Tool from the vehicle make sure the Scanner software is not communicating with the vehicle 1 From a codes or data display screen select the Exit icon on the upper toolbar Figure 4 34 Exit icon The screen goes to the codes or data menu 2 Select the Back icon on the upper toolbar Figure 4 35 Back ...

Страница 64: ... and transmits vehicle data to the diagnostic tool The Scan Module operates on 12 or 24VDC vehicle power supplied through the vehicle s data link connector DLC 1 Data cable connector 2 Vehicle power LED green 3 Communication issue LED red 4 Bluetooth LED green 5 Memory card port remove protective hand grip for access 6 Universal serial bus USB jack remove protective hand grip for access Figure 5 1...

Страница 65: ...ool 1 Turn on the diagnostic tool IMPORTANT The Scan Module needs to be powered on during the pairing process Connect the Scan Module to a vehicle or to the diagnostic tool using the USB cable Make sure the diagnostic tool has a charged battery or is connected to the AC DC power supply 2 Connect the 26 pin end of the data cable to the Scan Module data cable connector 3 Connect the 16 pin end of th...

Страница 66: ...st A search in progress message displays during the pairing procedure Figure 5 3 the Paired Devices screen Figure 5 4 displays once the procedure completes Figure 5 3 Sample pairing in progress message 7 Select the Home icon on the Toolbar 8 Disconnect the data cable from the vehicle The Scan Module and diagnostic tool are now paired for wireless communication and should automatically recognize ea...

Страница 67: ...liant vehicles Use the supplied DA 4 data cable with the optional DA 5 adapter and a manufacturer specific adapter The 26 pin end of the cable attaches to the data cable connector on the Scan Module The16 pin end connects to the DA 5 adapter the DA 5 adapter connects to the manufacturer specific adapter and then connects to the vehicle DLC The cable connectors are secured with captive screws While...

Страница 68: ...ng idle particularly if the devices have been stationary 5 5 1 No Communication Message If the Scan Module is paired to the diagnostic tool and tries to communicate with the vehicle and the Scan Module is not connected to the vehicle a Connect Data Cable or no communication message displays A signal lost due to moving out of range automatically restores itself when the diagnostic tool is brought c...

Страница 69: ... connection The red Communication LED flashes on and off when the Scan Module is performing an internal self test and is illuminated continuously if a failure is detected Figure 5 6 Hardware Icon Background Color Condition Action Red Not Paired Pair the Scan Module to the diagnostic tool See Pairing The Scan Module on page 55 for instructions Grey Paired but Not Communicating You may have moved ou...

Страница 70: ...le On Solid the Scan Module is being powered by the vehicle but not communicating with the Diagnostic Tool Flashing the Scan Module is being powered by the vehicle and is communicating with the Diagnostic Tool Communication Off normal state no errors detected On Solid communications error detected Flashing internal self test in process will go out once the test completes Bluetooth Off there is no ...

Страница 71: ...nnectivity 1 Disconnect the Scan Module from the vehicle 2 Navigate to the Home Screen on the diagnostic tool 3 Select Exit to close the ShopStream Diagnostic Suite 4 Connect the Scan Module to the vehicle 5 Select the ShopStream Diagnostic Suite icon on the desktop Figure 5 7 Sample ShopStream Diagnostic Suite desktop icon NOTE i The ShopStream Diagnostic Suite can also be started from the Window...

Страница 72: ... on the diagnostic tool 2 Select Exit to close the ShopStream Diagnostic Suite 3 Wait for the Scan Module Communication LED to stop flashing 4 Select the ShopStream Diagnostic Suite icon on the desktop The ShopStream Diagnostic Suite should open with connectivity restored Windows Reboot Procedure This method which completely shuts down the diagnostic tool takes several minutes to complete z To reb...

Страница 73: ...sition To avoid damaging the Scan Module never turn the ignition switch ON during the update process IMPORTANT To avoid damaging the diagnostic tool or scan module it is highly recommended to connect the AC DC power supply to the diagnostic tool before starting the firmware update process Damage can occur to the scan module if the diagnostic tool power is turned off or the power supply is disconne...

Страница 74: ...Module Firmware Update Process USB cable If necessary this alternate firmware update procedure may be used to update the Scan Module firmware IMPORTANT The diagnostic tool must be connected and powered by the AC DC power supply during the Scan Module firmware update process Damage can occur to the Scan Module if the diagnostic tool power is turned off or the power supply is disconnected during the...

Страница 75: ... small end of the USB cable into the USB jack on the Scan Module d Plug the large end of the USB cable into one of the USB jacks on the side of the diagnostic tool NOTE i When connected the scan module USB connection status icon background color will change from gray to green 1 Hinged cover 2 USB jack Figure 5 12 Scan Module USB jack 4 Select Scanner from the diagnostic tool Home screen 5 Select O...

Страница 76: ...ware A successfully updated message displays once the installation process is complete Figure 5 14 Figure 5 14 Firmware update complete message 6 Select OK to close the message and return to the Scanner function The updated Scan Module is ready to use ...

Страница 77: ...s related This mode is also used for testing OBD II EOBD compliant vehicles that are not included in the Scanner databases OBD Direct is a Scanner function and the Scan Module must be connected to the test vehicle and communicating with the diagnostic tool This function only provides generic OBD II EOBD information To access enhanced OBD II EOBD functions select Scanner from the Home screen Option...

Страница 78: ...I Code Check This option displays any stored emission related generic DTCs reported by the ECM Selecting opens a submenu with two choices Codes Pending Codes Codes Codes displays a list of current emission related DTCs OBD II EOBD Codes have a priority according to their emission severity with higher priority codes overwriting lower priority codes The priority of the code determines the illuminati...

Страница 79: ...lure after additional driving then a DTC is set to indicate a faulty component or system and the MIL is illuminated 6 1 2 Global OBD II Clear Codes This option is used to clear all emission related diagnostic data such as DTC records freeze frame data and test results from ECM memory Although OBD Direct only displays generic OBD II data clearing codes erases all of the stored data including any en...

Страница 80: ...pens a menu with the following options Start Communication begins the test session Connector Information provides data link connector DLC location details for most models Manual Protocol Selection allows you to select which protocol to use 6 2 1 Start Communication Use the following procedure to conduct an OBD Direct test session z To perform an OBD Direct Test 1 Select Start Communications from t...

Страница 81: ... many ECMs were detected which ECM is communicating and which communication protocol is being used displays Figure 6 5 Figure 6 5 Sample communication message 3 Select Continue and a menu of available tests displays Figure 6 6 Figure 6 6 Sample Start Communication menu 4 Select a test to continue ...

Страница 82: ...osis process as it contains information on virtually all common diagnostic trouble code DTC problems and driveability symptoms for most vehicles covered by the vehicle communication software 01 Display Current Data Use this item to display the current emission related data from the selected electronic control module ECM of the vehicle Displayed data includes analog inputs and outputs digital input...

Страница 83: ... vehicle Select a test and follow the on screen instructions 09 Read Vehicle Identification This selection displays the vehicle identification number VIN the calibration identification and the calibration verification number CVN of the test vehicle 09 In use Performance Tracking This selection displays the In use Performance Tracking of monitored data It is basically a record of the number of time...

Страница 84: ...menu 6 2 3 Manual Protocol Selection A communication protocol is a standardized way of data communication between an ECM and a scan tool Global OBD may use several different communication protocols The scan tool automatically connects to an available protocol which displays on the connection message Figure 6 5 Some vehicles communicate on more than one protocol Use the Manual Protocol Selection op...

Страница 85: ...tive 12V systems do not use this product for Measurement Categories II III and IV Measurement Category I is for performing measurements on circuits not directly connected to MAINS or MAINS circuits an example of a MAINS circuit is 120V AC or 240V AC household or industrial electricity do not connect this product to MAINS or MAINS circuits Do not apply the Black Ground Lead to test points other tha...

Страница 86: ...nd paper orientation Top Level Menus Selecting Top Level Menus opens a list that may include the following options Power User Tests How To Features Benefits Index United Kingdom Only Features Benefits Selecting Features Benefits opens a menu page that includes 5 Minute Walk Thru With Demo Board Australia Only explains how to use the optional demonstration board to generate sample signals Features ...

Страница 87: ...Cooling System Class provides a basic system overview 15 Minute Tyre Pressure Monitoring System Class provides a basic system overview 15 Minute Voltage Drop Diagnosis Class covers performing voltage drop tests and using the results to diagnose circuit failures 15 Minute Lin Bus Class provides brief instruction on LIN BUS systems Illustrated Terms Definitions provides definitions of terms drawings...

Страница 88: ...anufacturer you want to include selected manufactures are highlighted NOTE i Manufacturers appear on the favorites list in the order in which they are selected Therefore if you select the makes you work on most frequently first they will appear at the top of the list 3 Select Finished on the toolbar once your selections have been made The screen returns to the manufacturer list but only the makes ...

Страница 89: ...the fuel injection system is typical of what to expect z To identify a vehicle for Guided Component Test 1 Select the Guided Component Test Function icon from the Home screen 2 Select which database to load for the test vehicle if requested optional After the database loads a list of manufacturers displays 3 Select FORD and a model year menu displays 4 Select 2008 from the year menu and a list of ...

Страница 90: ...t 9 Select a test to continue The identification sequence is now complete refer to the Operations section that follows for details on how to navigate through the Guided Component Test information and perform tests NOTE i If you return to the Home screen and select Scanner or Vehicle History the vehicle identification entered here is carried over However additional information may be needed by some...

Страница 91: ... and testing time 7 2 1 Component Information Component Information provides details on specific vehicle components to provide a better understanding of the components prior to diagnosis The Component Information screens contain information to assist you with testing The screens are divided in sections to help quickly guide you to the correct information Figure 7 6 Operation provides a general des...

Страница 92: ...w and where to connect the test meter leads and also automatically configures the multimeter or lab scope to perform the selected test Once a test vehicle is identified you can select a component from the available tests list z To select a test 1 Select a component from the list 2 Select TEST to open the list NOTE i More than one selection is available in some instances For example select Ignition...

Страница 93: ...g additional information or open an additional window on top of the current screen Hyperlinks display as icons Common hyperlinks are View Meter opens a live meter set up to perform the test in the lower portion of the screen Figure 7 9 Once the meter view is open the Guided Component Test toolbar at the top of the screen is replaced by the Scope Multimeter toolbar which allows you to make adjustme...

Страница 94: ...View Meter active Figure 7 9 select the Meter icon on the toolbar once and the meter expands to fill the entire screen 2 Select the Meter icon a second time and the meter open as a separate window Figure 7 10 This window can remain open if you switch to the Scanner function and can be accessed from the Windows toolbar at the bottom of the screen You can also resize and reposition the meter window ...

Страница 95: ...d component tests require the use of specific leads Information on specific leads and other connecting information displays on the initial test screen Follow the on screen connection instructions in the test procedure to connect the test leads Performing a Test Once you connect the test leads to the vehicle you can proceed with testing z To perform guided component tests 1 Follow the instructions ...

Страница 96: ...g measurements on circuits not directly connected to MAINS or MAINS circuits an example of a MAINS circuit is 120V AC or 240V AC household or industrial electricity do not connect this product to MAINS or MAINS circuits Electrical shock can cause personal injury equipment damage or circuit damage IMPORTANT Maximum rated transient over voltage impulse is 500 volts do not exceed the rated transient ...

Страница 97: ...ommon ground input GND black banana jack Sample Rate 1 5 MSPS Continuous sampling MSPS mega samples per second Bandwidth DC 3 MHz 3 db point 3 MHz Input Impedance 10 MOhm DC 4 kOhm 3 MHz Channel 1 4 VDC Full Scale 75VDC Do not measure greater than 75VDC VAC Full Scale 50VAC Do not measure greater than 50VAC rms Low Amp Probe 20A scale 100mV Amp 40A scale 10mV Amp Connect Low amp Probe to Ch 1 yell...

Страница 98: ...agnostic tool and the color of trace 1 on the test screens This yellow lead includes a black right angle common ground plug and a black stackable right angle common ground plug The non stackable ground plug always connects to the ground GND jack on top of the diagnostic tool The stackable ground plug is used for connecting additional leads such as the Channel 2 Lead or the Secondary Coil Adapter L...

Страница 99: ...re 8 4 is used for either Channel 4 or Digital Meter plus The lead color matches the color of socket 4 on the diagnostic tool as well as the color of trace 4 on the test screen Alligator Clips Figure 8 5 Alligator clip Four insulated alligator clips are included and colored to match each test lead a black clip for the common ground lead is also supplied Figure 8 5 Each clip plugs into the straight...

Страница 100: ...y Ignition Clip on Wire Adapter The optional Secondary Ignition Clip on Wire Adapter Figure 8 8 connects the Secondary Coil Adapter lead to the vehicle Secondary wire to display ignition patterns Inductive RPM Pickup Adapter optional Figure 8 9 Inductive RPM Pickup adapter The optional Inductive RPM Pickup adapter Figure 8 9 connects to the scope auxiliary jack of the diagnostic tool with a DB9F p...

Страница 101: ...t or save a copy of the data currently being viewed Selecting opens a submenu Save Multimeter opens an additional submenu with these options Save Configuration saves the current screen setup as a preset for quick access Save Single Frame saves a recording of the current screen Save All Frames saves a recording of the current screen plus all the data in the buffer Print opens a standard Windows Pri...

Страница 102: ...8 2 Navigation The following section describes how to navigate the screen interface 8 2 1 Screen Layout The screens typically include the following sections Figure 8 11 Scope Multimeter Toolbar allows you to configure the tool for the type of test and to adjust the settings for each channel or trace Main Body of the screen displays test results Options on the toolbar let you select how tests displ...

Страница 103: ...ief descriptions of the control icons on the toolbar Table 8 4 Scope Multimeter toolbar icons part 1 of 2 Name Icon Description Back Returns to the previously viewed screen Setup Opens a dialog box that allows you to select personal preferences for viewing and saving data Data Switches the trace information displayed at the base of the screen between three available states Cursors Opens a dialog b...

Страница 104: ...e screen can be used to quickly adjust settings for capturing the trace The Trace details are accessed using either the Data icon on the upper toolbar or the Touch and Grow icon fingerprint icon on the Playback toolbar Both icons function the same and cycle the Trace Details selection through three states Displayed trace settings are displayed in this mode Expanded trace settings are displayed in ...

Страница 105: ...e or other interference Inverted switches the polarity of the displayed signal Coupling AC subtracts the average value of the waveform by blocking the DC portion of an input signal in order to amplify the AC portion This allows small variations in the trace to become visible Scale opens a dialog box that allows you to select the scale which is the total value displayed on the vertical axis of the ...

Страница 106: ...tep Back Moves to the previous point in the recorded data Back 1 Frame Moves to the previous frame in the recorded buffer Stop Stops recording data Record Begins recording data Play Recording Plays the data recording in a continuous loop at actual speed Forward 1 Frame Moves to the next frame in the recorded buffer Step Forward Moves to the next point in the recorded buffer Position Indicator In r...

Страница 107: ...ox must be closed to return to the main window and continue Make a selection to close the dialog box 8 3 Operations This section describes configuring the scope or meter and performing tests Selecting View Meter from a Guided Component Test or Scanner screen saves time by automatically configuring the scope or meter 8 3 1 Starting the Scope and Multimeter Use the following procedure to set up the ...

Страница 108: ...sure Graphing Options The following options are available for testing 4 Channel Graphing Volts DC Volts DC Average Volts AC RMS Frequency Pulse Width Injector Pulse Width Duty Cycle Low Amps 20 Low Amps 40 Low Amps 60 MC Dwell 60 MC Dwell 90 100 PSI Vacuum 100 PSI Pressure 500 PSI Pressure 5000 PSI Pressure Ignition Scope Options The following options are available for testing Parade Cylinder Rast...

Страница 109: ...pointing DOWN measurement under minimum range Voltage measurements also display arrows in place of live values when the voltage exceeds the input rating of the meter 51 1 Risk of electrical shock Do not exceed voltage limits between inputs as indicated on the rating label Use extreme caution when working with circuits that have greater than 40 volts AC or 24 volts DC Electrical shock can cause per...

Страница 110: ...n 3 Trace Scale icon 4 Trace characteristics check boxes 5 Baseline position 6 Auto Find icon 7 Back icon 8 Exit icon Figure 8 14 Traces dialog box 4 Select the Trace Probe icon to open the menu 5 Highlight a probe on the list and select OK to close the window 6 Select the Trace Scale icon to adjust the vertical scale of the display A dropdown menu opens menu options vary depending upon which test...

Страница 111: ... halfway between the minimum and maximum value of the sampled signal to provide a stable waveform 10 The baseline position is the zero line of the trace use the slider and arrows to adjust it 11 Select Back to return to the Preferences dialog box or select Exit to close the dialog box and return to the scope Sweep Controls Sweep is the amount of time represented by the screen or the horizontal sca...

Страница 112: ...ing event Trace 1 sets the trigger to channel 1 Trace 2 sets the trigger to channel 2 Trace 3 sets the trigger to channel 3 Trace 4 sets the trigger to channel 4 Cylinder sets triggering to the firing of a cylinder detected by the optional RPM Pickup or Secondary Ignition Adapter 2 Mode sets the method of triggering Auto automatic if a trigger is found the waveform displays If a trigger is not fou...

Страница 113: ... use to adjust time and voltage interval settings Selecting from the submenu opens a dialog box for that item Dialog box options for each item are discussed in the following sections 3 Make dialog box selections as needed 4 Select Back to return to the Preferences dialog box or select Exit to close the dialog box and return to the scope Display Settings Selecting Display from the View submenu open...

Страница 114: ... Colors switches the screen background to white Layout Settings The selected radio knob on the Layout dialog box shows which setting is active Use a finger or the stylus to switch between settings 1 window shows all traces on the same screen Figure 8 19 2 windows shows two separate traces in two ways horizontal one below another Figure 8 20 or vertical side by side Figure 8 21 Figure 8 20 Sample 2...

Страница 115: ...ons Figure 8 21 Sample 2 Windows vertical display 3 windows shows three traces one below another on the same screen Figure 8 22 Figure 8 22 Sample 3 Windows display 4 windows shows four traces one below another on the same screen ...

Страница 116: ...e Scope Multimeter Preferences dialog box opens 2 Select Setup from the dialog box A submenu of options displays Units use to set how measurement values display US standard or metric Snapshot use to adjust the percentage of data captured following a trigger event Ignition use to configure the optional ignition scope for the test vehicle Selecting from the submenu opens a dialog box for that item D...

Страница 117: ...h data is captured after a snapshot is triggered Figure 8 25 Available selections which range from ten to ninety percent in ten percent increments are shown as icons with the current setting highlighted Select a icon then select OK to close the dialog box Figure 8 25 Sample Snapshot dialog box Refer to Trigger Controls on page 102 for information on how to setup a trigger kg cm2 kilograms per cent...

Страница 118: ...plug systems Other use for systems that do not fit any of the above categories 4 Select the number of cylinders for the test vehicle in the Cylinders field Scroll through the list using the up and down arrows on either side of the number 5 This step varies depending upon the type of ignition system If testing a Standard system select the Firing Order If testing an Other system select the RPM Facto...

Страница 119: ...e icon 4 Back icon Figure 8 27 Cursor controls Cursor 1 the top slider and arrows is the left hand cursor on the screen Cursor 2 the lower set of controls is the right hand cursor on the screen Drag the slider or select the arrows to position the cursors Each tap of the stylus moves the cursor incrementally in the direction of the arrow Select Show to display the cursors the icon changes to Hide S...

Страница 120: ...con or select return on the keyboard Figure 8 29 A configuration description dialog box opens NOTE i The description entered here is what displays in the information panel of the Data Manager 4 Use the keyboard to enter a description of the file to be saved 5 Select the OK icon or select return on the keyboard 6 Select OK to close the file setup dialog box Once a configuration is saved it becomes ...

Страница 121: ...open the program A brief description of what type of information is available and how to navigate through the data follows below 9 1 Vehicle Identification What happens when theInformation icon is selected from the Home screen depends upon whether or not a test vehicle has been identified With no active vehicle the first in a series of vehicle identification screens that allow you to select the ye...

Страница 122: ...diagnostic trouble code DTC problems See Diagnostic Trouble Codes on page 113 Engine Management Component Testing Provides information on performing tests on engine management components See Engine Management Component Testing on page 115 Engine Management Pin Data Provides connector diagrams and pin assignment information for engine management systems See Engine Management Pin Data on page 118 Co...

Страница 123: ...ight all of the correct options installed on the test vehicle then select the Accept icon to continue The Diagnostic Trouble Codes screen opens 9 2 1 Diagnostic Trouble Codes Screen The DTC screen is divided into two main fields the selection field on the left hand side and the information field on the right hand side The selection field which determines what information is shown in the informatio...

Страница 124: ... Code Information All or part of the diagnostic trouble code information can be sent to a printer z To print diagnostic trouble code information 1 Select the Print icon on the toolbar see Toolbar on page 121 for details The Print Options window opens Figure 9 4 Figure 9 4 Sample Print Options window 2 Select the check boxes for the options to be printed 3 Select OK to send the selected information...

Страница 125: ...typical choices include Diagnostic Trouble Codes this is the same information available from the Diagnostic Trouble Codes icon see Diagnostic Trouble Codes on page 113 for details Component Testing provides detailed procedures and specifications for testing system components and performing service operations Wiring Diagram this is the same information available from the Wiring Diagrams icon see Wi...

Страница 126: ...he screen displays an article that provides procedures for testing system components See Component Test Information on page 117 Figure 9 6 Sample component testing screen Toolbar Toolbar icons allow you to quickly move between operations and functions The number of icons that are active depend upon what information is currently being displayed An inactive icon is indicated by an X in the upper lef...

Страница 127: ... an item from the submenu takes you directly to that point of the article Next Illustration Advances to show the next illustration in the displayed article Wiring Diagram Opens a wiring diagram for the test vehicle This is the same diagram available from the Wiring Diagrams module see Wiring Diagrams on page 121 for details Component Locator Opens an engine bay component location illustration This...

Страница 128: ...nent testing article for that item See Engine Management Component Testing on page 115 for additional information If a number appears in the Waveform column a known good sample waveform is available for viewing Select the number with the stylus and the waveform opens in a separate window Select anywhere in the waveform window to close it 9 4 1 View Tabs The View Tabs determine which perspective of...

Страница 129: ...h the data Use your finger or the stylus to select an information tab 9 4 3 Component Selection This field which only displays when the By Component or By Pin Number tab is selected is used to select what data displays in the table z To use component selection 1 Select anywhere in the Component Selection field with the stylus The menu sorted by component or pin as determined by the Information Tab...

Страница 130: ...Selection Menu 5 Location Diagram Figure 9 9 Sample fuse box relay plate screen A toolbar located above the diagram offers shortcuts to certain operations Toolbar icon operations are the same as for Engine management Component Testing see Toolbar on page 116 for descriptions which toolbar icons display varies by category A component selection menu appears between the toolbar and the main screen on...

Страница 131: ...in Figure 9 10 1 Toolbar 2 Component Selection Menu 3 Full width Window 4 Magnified Window Figure 9 10 Sample wiring diagram screen 9 6 1 Toolbar Most of the toolbar icon are the same as for Engine management Component Testing see Toolbar on page 116 for descriptions However there are some icons that only appear on wiring diagrams These are explained in the table below Table 9 3 Information icon d...

Страница 132: ...any portion of the full width diagram with the stylus and that area of the wiring diagram displays in the magnified window Selecting a component on the full width diagram with the stylus highlights that component in red displays its name in the component selection menu window and displays that portion of the wiring diagram in the magnified window Move the full width diagram scroll bar and the magn...

Страница 133: ...y Toolbar 2 Main Body Records List Figure 10 1 Vehicle records list screen 10 1 1 Vehicle History Main Body Records List The main body of the screen lists all of the available vehicle records By default records are shown in the order in which they are entered However you can resort them by any of the categories shown as column headings You can also resize the individual columns z To sort records 1...

Страница 134: ...ehicle record on the records list screen 2 Select Activate from the toolbar The Activate icon is removed from the toolbar once a vehicle has been selected 3 Select the Home icon The Home screen displays with the activated vehicle shown on the toolbar 4 Select any Function icon on the Home screen to begin testing Table 10 1 Toolbar icons Name Icon Description Back Returns to the previously viewed s...

Страница 135: ...ehicle ID information is captured slightly different across the different functions e g Scanner Guided Component Tests etc as some functions may capture more less information during the process Selecting the Other Vehicle ID button opens a listing of the captured vehicle ID fields from each applicable function If more than one function was used to ID the vehicle you are given the option to use tha...

Страница 136: ...or use the Select All or Deselect All options to remove all records Figure 10 3 Figure 10 3 Search and Show All Selecting Search opens a dialog box that allows you to search vehicle records by category You can search for data in the following categories Year Make Model Color Customer License State Technician z To search 1 Select Search from the toolbar 2 Enter the search criteria in the text field...

Страница 137: ...s list screen with only the records found in the search criteria showing 4 Select Show All on the toolbar to restore the complete vehicle records list Settings Use Settings to determine which categories display on the vehicle records list screen Selecting the Settings icon opens a vehicle history category display menu z To change Settings 1 Select Settings to open the menu Figure 10 5 Sample Setti...

Страница 138: ...ory Operations Screen Layout 2 Select or deselect the desired categories Highlighted items do not display Non highlighted items display 3 Select OK on the toolbar to accept the changes and return to the previous screen ...

Страница 139: ...y of the saved file when available and the preview panel on the lower right displays an image if the selected file is a graphic 1 Data Manager Toolbar 2 Folders Panel 3 Preview Panel 4 Information Panel Figure 11 1 Sample Data Manager main screen The main screen includes folders for saved files from the various modules Camera Folder contains photographs taken with the built in camera See Image Vie...

Страница 140: ...played in the folders panel up one level in the file structure Open Opens the highlighted folder or file New Creates a new folder Delete Moves the highlighted file or folder to the recycling bin Rename Opens a dialog box and the virtual keyboard for renaming the selected file or folder Save The Save function is not implemented at this time Properties Opens a dialog box and the virtual keyboard for...

Страница 141: ...olbar 11 3 2 Up This icon reflects the items shown in the folders panel of the screen up in the file structure one level at a time For example one tap of the Up icon when viewing the contents of the Scanner Data Folder returns you to the main screen A second tap would display the contents of the My Documents folder 11 3 3 Open The Open icon is only active displays in color when an item in the fold...

Страница 142: ... return to the previous page 11 3 4 New The New icon allows you to create a new folder This option is only available when the icon displays in color z To create a new folder 1 Select the New icon on the toolbar The New Folder Name dialog box opens Figure 11 3 2 Select the entry field on the dialog box to open the virtual keyboard 3 Type a name for the new folder using the virtual keyboard 4 Select...

Страница 143: ...s to delete the file or Cancel to exit z To delete an item 1 Select to highlight the item or folder to be deleted 2 Select the Delete icon on the toolbar A confirmation message displays Figure 11 4 Figure 11 4 Sample delete confirmation message 3 Select OK to delete the selected item and return to the previous page The Cancel icon returns you to the previous page without deleting the selected item...

Страница 144: ...Select the Rename icon on the toolbar The New Name dialog box opens Figure 11 3 Figure 11 5 Sample new name dialog box 3 Select the entry field on the dialog box to open the virtual keyboard 4 Type the new name into the entry field using the virtual keyboard 5 Select the OK icon to change the name and return to the previous page The Cancel icon returns you to the previous page without changing the...

Страница 145: ...igure 11 3 Figure 11 6 Sample Properties dialog box without the virtual keyboard 3 Type a new name into the field using the virtual keyboard if you want to rename the file 4 Use either the virtual keyboard or the dropdown menus to fill in the Year Make Component and Condition fields 5 Select the OK icon to change the name and return to the previous page The Cancel icon returns you to the previous ...

Страница 146: ...NOTE i This diagnostic tool is equipped with Microsoft Outlook Express e mail client To use this client open the Microsoft Outlook Express program and run the New Connection Wizard following the screen prompts and then either create an e mail account or use your existing account to complete the setup You may be required to enter setup information e g incoming and outgoing server names types and po...

Страница 147: ... 5 Select the Send icon to send the e mail NOTE i You must have an Internet connection to send e mail z E mail client installation and setup Example The following instructions are intended as a guide only as e mail client setup procedures vary 1 Download an email client e g Mozilla Thunderbird Figure 11 9 Figure 11 9 attachment ...

Страница 148: ...ager Operations Operations 2 Install the software following the screen prompts Figure 11 10 Figure 11 10 3 Continue through the setup If available choose set as my default mail application Figure 11 11 Figure 11 11 ...

Страница 149: ...t Figure 11 12 Figure 11 12 5 Enter your e mail information as required Figure 11 13 NOTE i E mail client configuration settings should automatically be set during installation If problems arise with the setup and manual configuration is needed refer to the e mail client help information and the Windows help information Figure 11 13 ...

Страница 150: ...sword to allow the client to continue the setup with your provider Figure 11 14 Figure 11 14 7 Follow the screen prompts to allow the client to link to your email address 8 Once the client has successfully linked to your address you can begin using the new e mail client software on the diagnostic tool Figure 11 15 Figure 11 15 ...

Страница 151: ...page 141 for additional information 11 4 1 ShopStream Connect Data files saved on your diagnostic tool are designed and intended to be reviewed using the Data Manager functions as described earlier An alternative method can be used to review select data files on a PC using ShopStream Connect ShopStream Connect is PC based program that allows you to manage view and print data files using a PC ShopS...

Страница 152: ...ved Scanner data files select the Scanner Data Folder menu option from the Data Manager main menu Scanner DataViewer Opens pids scm scs scp and spm file extensions 1 Menu bar 2 Display toolbar 3 Graph display 4 Properties icon 5 Vertical Scroll bar 6 Zoom controls 7 Slider bar 8 Navigation toolbar 9 Parameter text list 10 Parameter configuration tabs Figure 11 17 Scanner Data Viewer ...

Страница 153: ...ngs include print as graphs or text which pids to include number of pids per page display colors and the text font Figure 11 18 Figure 11 18 Pids print settings z To print 1 Select the desired pids A checked box indicates the pid will be printed Select again to deselect the pid 2 Select Change to modify the font this opens a standard Windows font dialog box a Modify the font as desired b Select OK...

Страница 154: ... displayed on the screen Figure 11 20 Figure 11 20 Scanner DataViewer View menu Select from the following menu options Text Only shows all parameters and their values as text only Graphs Only shows all parameters as graphs only Text and Graphs shows all parameters and their values as text in the left panel of the screen and shows them as graphs in the right panel of the screen ...

Страница 155: ...to open a color palate Sweep use to adjust the number of data frames that appear on the screen zoom in or out highlight and type in the desired number Reset Colors use to restore the default color settings Data Item use this pulldown menu to select individual graphs for modification Auto Scale minimum and maximum Y axis values automatically adjust to the signal when the box is checked uncheck the ...

Страница 156: ...provides the following controls Figure 11 22 Exit closes Scanner DataViewer Hide PID List toggles display between parameter text and graph views Display Views 1 to 16 determines how many graphs display at a time Scale switches the scale values shown to the left of the graph off and on Sweep switches the sweep values shown below the graph off and on Figure 11 22 Display toolbar ...

Страница 157: ... multiple steps 2 Step Back Allows backward movement in singular steps 3 Play Select to play 4 Step Forward Allows forward movement in singular steps 5 Skip Forward Allows forward movement in multiple steps 6 Pause Select to pause playback Figure 11 23 Playback controls Zoom Controls The zoom controls allow you to incrementally increase or decrease the screen magnification Figure 11 24 Figure 11 2...

Страница 158: ...During playback the number displayed on the left side of the slider bar indicates the current position of the cursor in the data file The cursor can be repositioned during playback or when paused by selecting and dragging Use the scroll bar right side to vertically scroll through the parameter list and graphs 1 Cursor 2 Scroll bar 3 Slider bar Figure 11 25 ...

Страница 159: ...ized by selecting and dragging parameters from the text list or graph display to a different location in the text list or in the graph display Figure 11 26 The highlighted parameters in the text list indicate which parameters are displayed as graphs NOTE i The parameter text list is sortable by name and value Select Name or Value at the top of the list to change the sorted view Figure 11 26 ...

Страница 160: ...meter configuration tabs allow you to choose between displaying all available parameters Complete List or only those from a Custom List Figure 11 27 z To customize the parameter list 1 Select the Custom List tab Figure 11 27 2 Select Edit List in the custom window 1 Edit List 2 Custom List tab Figure 11 27 ...

Страница 161: ...re 11 28 3 Select the parameters to include in your custom list Select All and Deselect All controls are also available to assist in the selection process Figure 11 28 Creating a custom parameter list 4 Select Save Exit to close the window Only the parameters selected in your custom list are displayed ...

Страница 162: ...scope file is selected it opens and displays in the Scope File Viewer The Scope File Viewer is intended to be used to review scope and meter files originally captured on a diagnostic tool Some features control icons of the Scope File Viewer may not be available grayed out This is normal as those features are only applicable when viewing live data on a diagnostic tool The Scope File Viewer screen i...

Страница 163: ...er Operations Image Viewer 11 8 Image Viewer The Image Viewer allows you to open and view image files and screenshots Figure 11 30 1 Exit closes the Image Viewer 2 Print prints the image 3 Captured Screen Image 3 1 2 ...

Страница 164: ...p of the screen is used to adjust screen magnification and to exit Help Table 12 1 Help toolbar icons Name Icon Description Back Closes the help file and returns you to the previously viewed screen Zoom Incrementally increases the screen magnification Zoom Incrementally decreases the screen magnification Reset Restores the default screen magnification Previous Page Moves back one page in the docum...

Страница 165: ...s vehicle data readily available on the Diagnostic Tool while working anywhere on or around the vehicle Before use wireless units must be paired in order to create a communications network between them Information about modules paired to the Diagnostic Tool can be found by selecting System Settings from the Home screen z To check the devices paired to your Diagnostic Tool 1 Select System Settings ...

Страница 166: ... Not Paired Pair the Scan Module to the Diagnostic Tool See Pairing The Scan Module on page 55 for instructions Grey Paired but Not Communicating You may have moved out of range Move the Diagnostic Tool closer to the Scan Module to reestablish communications If connectivity is not restored perform the Recovery Procedure on page 61 Blue Paired and Communicating Hardware status is good and Bluetooth...

Страница 167: ...on dialog box opens Figure 13 2 Figure 13 2 Sample Shop Information dialog box 3 Select within any of the information fields and the virtual keyboard opens 4 Use the virtual keyboard to fill in the Shop Information form As an alternative you can connect a USB keyboard to a USB jack on the Diagnostic Tool and use it to enter information into the form 5 Close the virtual keyboard and review the info...

Страница 168: ...saved data The following types of data are backed up ShopStream Data saved movie data files Lab Scope Settings presets Vehicle History Records and Favorites z To Backup Information 1 From the Home screen select System Settings 2 From the System Settings main menu select Data Backup Backup The destination drive dialog box opens Figure 13 3 3 Select a drive destination NOTE i Drive designations e g ...

Страница 169: ...information z To perform a data Restore 1 From the Home screen select System Settings 2 From the System Settings main menu select Data Backup Restore The restore file confirmation dialog box opens Figure 13 4 3 Select Continue Figure 13 4 The Windows restore backup file path dialog box opens 4 Select the backup file file extension sna from your backup file location 5 Select Open to restore the bac...

Страница 170: ...ware update installed the Wi Fi radio turned on and connected to a wireless network 14 1 SureTrack Access SureTrack is included with current Diagnostic Tool system software To use SureTrack you must have the current software upgrade installed on your Diagnostic Tool As a reminder to keep your software current and retain your access to SureTrack software upgrade reminder messages will display perio...

Страница 171: ...he current software upgrade Your SureTrack access has expired See your Snap on representative to renew indicates your access to SureTrack has expired and you should contact your sales representative to purchase the current software upgrade Verified parts replacement data not available indicates repair and or diagnostic information is not available at this time for the identified vehicle Network no...

Страница 172: ...les Figure 14 3 Typical Common Replaced Parts Graph 1 Common Replaced Part Graph icon toggles Common Replaced Parts graph display on off 2 Common Replaced Part Graph 14 2 2 Dashboard Feature Information Dashboard Feature Information includes Detailed DTC Information Related Tips Real Fixes and Repair Information SureTrack can display detailed information about the current DTC describing code setti...

Страница 173: ...re also provided for the following Related Tips opens a list of tips that may include information that is related to the current DTC Figure 14 5 Figure 14 5 Typical Related Tips Screen Real Fixes opens a list of tips related to the current DTC that have been gathered from actual shop repair orders and presented in a Complaint Cause Correction format Figure 14 6 Figure 14 6 Typical Real Fixes Scree...

Страница 174: ...k Repair Information opens the Information function Figure 14 8 The Information program is a built in repair information database For additional information see Information on page 111 Figure 14 7 Figure 14 8 Information Main Menu ...

Страница 175: ...he SST automatically checks for new software updates This automatic check also occurs every time the diagnostic tool is turned on If a software update is available the SST will download it The SST is a low priority program that only downloads software updates when unused bandwidth is available If other programs are running that communicate over the Wi Fi network such as a browser or instant messag...

Страница 176: ...ows you to check the status of an active download Settings provides SST program options Turn on off automatic software installation Applies only for SST program updates The default setting is on box checked Set the hourly interval for the SST to check for software updates choose number 2 to 168 Applies to SST program updates and diagnostic tool software upgrades updates The default interval is 4 h...

Страница 177: ...stic tool Download times will vary as they are dependent on the file size of the upgrade some upgrades may exceed 3Gb and your connection speed It is suggested that you start the download at the end of your day and let it run overnight It is also suggested that you ensure a download of this size is within the available data allowance of the Internet connection or data plan being used For software ...

Страница 178: ...lable message displays Select the message to close it If updates are found they will automatically begin to download Figure 15 5 Figure 15 5 Typical Downloading update window NOTE i The percentage status bar may not always be displayed while downloading Figure 15 5 3 During an active download two options are available Minimize closes the message box The download continues as a background task and ...

Страница 179: ...ion is interrupted during a download the download is suspended and a network unavailable message displays The message disappears and the download resumes automatically once the Internet connection is restored 15 3 Installing Software Updates When a software update is ready for installation an installation update message will appear Figure 15 6 You can select the message or the SST icon from the sy...

Страница 180: ...e ShopStream Diagnostic Suite should remain closed until the software installation has completed 4 Follow the on screen instructions to complete the installation 5 After the installation is complete open the ShopStream Diagnostic Suite application 6 If applicable select Scanner from the Home Screen If a Scan Module firmware update has been received a Scan Module firmware update message will displa...

Страница 181: ...Module z To install a software upgrade 1 Select the software upgrade available message Figure 15 8 or the SST icon from the system tray Figure 15 8 Typical upgrade installation message An upgrade installation window will display Figure 15 9 Figure 15 9 Typical upgrade installation window 4IPQ4USFBN 6QEBUF 5PPM SJUJDBM VQEBUF BWBJMBCMF MJDL IFSF UP JOTUBMM VOEMF 7 3 5 BOE 7 364 JBHOPTUJD 4PGUXBSF 5...

Страница 182: ...lose the ShopStream Diagnostic Suite application The ShopStream Diagnostic Suite should remain closed until the software installation has completed 4 Follow the on screen instructions to complete the installation 5 After the installation is complete open the ShopStream Diagnostic Suite application 6 If applicable select Scanner from the Home Screen if a Scan Module firmware update has been receive...

Страница 183: ... screen calibration to maintain your personal settings The touch screen can also be set to recognize the stylus being held in place for five seconds as a right click of a mouse Both procedures are explained below z To calibrate the touch screen 1 From the Windows toolbar select Start All Programs Hampshire TSHARC Control Panel to open the touch screen dialog box Figure 16 1 Figure 16 1 Sample Hamp...

Страница 184: ...box 2 Select the Click Settings tab 3 Select the Enable Right Click check box 4 Set both the Right Click Area and Right Click Delay sliders to the middle of the bars 5 Select Apply to implement the new settings 6 Select OK to close the Control Panel dialog box 16 3 Cleaning and Inspecting the Diagnostic Tool When using the diagnostic tool make sure to do the following Check the housing wiring and ...

Страница 185: ...housing will void the product warranty Keep the following in mind when using and handling the battery pack Do not short circuit battery pack terminals Do not immerse the diagnostic tool or battery pack in water or allow water to enter the diagnostic tool or battery pack Do not crush disassemble or tamper with the battery pack Do not heat the battery pack to over 100 C 212 F or dispose of it in a f...

Страница 186: ...iginal Snap on replacement parts only z To replace the battery pack 1 Remove the right side handgrip from the diagnostic tool 2 Depress the lock tab on the back side of the battery pack 3 Slide the battery pack clear of the diagnostic tool 4 Fit the new battery pack into the slot 5 Install the handgrip 16 5 3 Disposing of the Battery Pack Always dispose of a lithium ion battery pack according to l...

Страница 187: ...tool contains Snap on System Restore software that returns the tool to original factory condition following a catastrophic failure Use the procedure below to restore the system if your diagnostic tool does not start the Windows operating system or if the hard disk drive or other system files have become corrupted IMPORTANT All data on the hard disk drive C is erased during a system restore If at a...

Страница 188: ...ring and connectors for dirt and damage before and after each use At the end of each working day clean the housing wiring and connectors with a clean damp cloth IMPORTANT Do not use any abrasive cleansers or automotive chemicals on the Scan Module 16 7 1 Replacing the Protective Handgrip The soft protective handgrip that covers the outer edges of the Scan Module is easily replaced should it become...

Отзывы: