


44
Scanner Operations
Scanner Operation
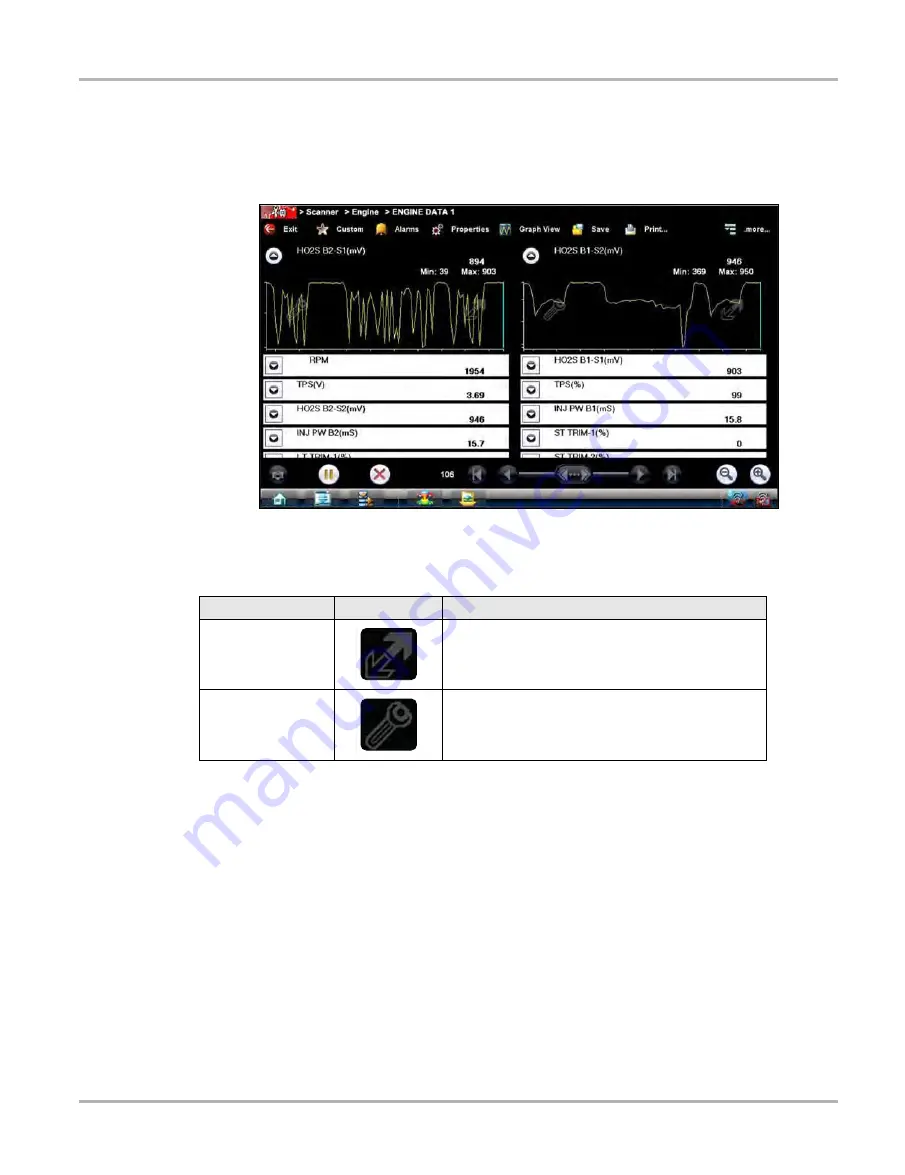
Data Graphs
Select the
Graph
icon to open a data graph for that parameter (
). Selecting a
parameter for graph view moves it to the top of the list. Select the
Graph
icon again to close the
graph for that parameter and return to a data list view.
Figure 4-24
Sample graph view
The icons that display on each data graph allow you configure settings for the selected graph only:
Triggers
Triggers establish threshold values, an upper limit and a lower limit, for recording a data snapshot.
A snapshot allows you to closely evaluate conditions that caused the triggering event.
When a snapshot is taken, the Scanner captures additional data after the trigger point is detected,
data collection pauses, and the buffered information is automatically saved as a movie. This gives
you a complete picture of what was happening before the fact, what occurred at the trigger point,
and what happened after the fact.
Data collection is paused following a trigger event. Select the
Play
icon to resume viewing live
data. A vertical line now appears on each of the data graphs to indicate the triggering point. The
trigger line on the parameter that triggered the snapshot is a different color than those on the other
graphs. This makes it easy to determine which parameter caused the trigger when triggers are set
for multiple parameters.
Table 4-3
Data graph icon operations
Name
Icon
Description
Expand/Collapse
Select to expand the graph to fill the entire screen,
select again to collapse the graph to the standard
view.
Graph Properties
Select to open the Graph Properties dialog box,
which allows you to set triggers for recording a
snapshot and to adjust the scale.
Содержание VERUS
Страница 1: ...User Manual EAZ0061B58A Rev E ...
Страница 4: ...iv ...


