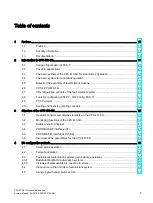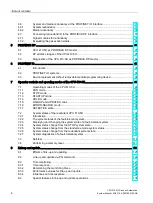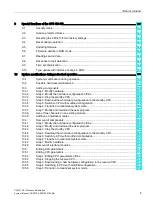
Table of contents
CPU 410-5H Process Automation
12
System Manual, 09/2014, A5E31622160-AB
Figure 15-4
S7 routing: TeleService application example ............................................................................. 248
Figure 15-5
Data set routing .......................................................................................................................... 250
Figure 15-6
Example of an S7 connection .................................................................................................... 257
Figure 15-7
Example that shows that the number of resulting partial connections depends on the con-
figuration..................................................................................................................................... 258
Figure 15-8
Example of linking standard and fault-tolerant systems in a simple bus system ....................... 261
Figure 15-9
Example of linking standard and fault-tolerant systems in a redundant bus system ................. 262
Figure 15-10 Example of linking of standard and fault-tolerant systems in a redundant ring ......................... 263
Figure 15-11 Example of linking standard and fault-tolerant systems in a single bus system ........................ 264
Figure 15-12 Example of redundancy with fault-tolerant systems and a redundant bus system with re-
dundant standard connections ................................................................................................... 265
Figure 15-13 Example of connecting a fault-tolerant system to a single-channel third-party system via
switched PROFIBUS DP ............................................................................................................ 266
Figure 15-14 Example of connecting a fault-tolerant system to a single-channel third-party system via
PROFINET IO with system redundancy .................................................................................... 267
Figure 15-15 Example of linking a fault-tolerant system to a single-channel third-party system .................... 268
Figure 15-16 Example of redundancy with fault-tolerant system and redundant ring ..................................... 272
Figure 15-17 Example of redundancy with fault-tolerant system and redundant bus system ......................... 273
Figure 15-18 Example of fault-tolerant system with additional CP redundancy .............................................. 273
Figure 15-19 Example of redundancy with fault-tolerant system and fault-tolerant CPU ............................... 275
Figure 15-20 Example of redundancy with fault-tolerant system and redundant bus system ......................... 277
Figure 15-21 Example of redundancy with a fault-tolerant system, redundant bus system and redun-
dant connection to the PC. ......................................................................................................... 277
Figure 15-22 Sequence of link-up and update ................................................................................................ 284
Figure 15-23 Update sequence ....................................................................................................................... 285
Figure 15-24 Example of minimum signal duration of an input signal during the update ............................... 286
Figure 15-25 Redundant one-sided and switched I/O ..................................................................................... 294
Figure 15-26 Flow chart for OB 1 .................................................................................................................... 296
Figure 15-27 Elements and composition of the cycle time .............................................................................. 299
Figure 15-28 Formula: Influence of communication load ................................................................................ 304
Figure 15-29 Distribution of a time slice .......................................................................................................... 304
Figure 15-30 Dependency of the cycle time on communication load .............................................................. 306
Figure 15-31 DP cycle times on the PROFIBUS DP network ......................................................................... 308
Figure 15-32 Shortest response time .............................................................................................................. 309
Figure 15-33 Longest response time ............................................................................................................... 310
Figure A-1
MDT ............................................................................................................................................ 324


