
90
Chapter 4: Graphing Features
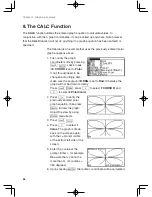
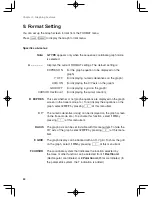
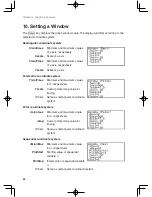
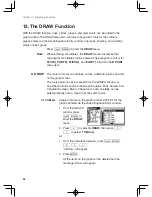
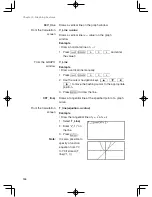
9. Format Setting
You can set up the Graph screen format from the FORMAT menu.
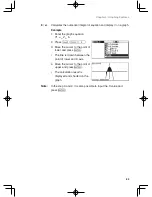
Press
@
f
to display the Graph format menu.
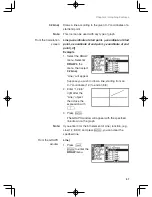
Specific sub-menus
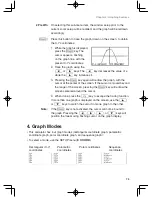
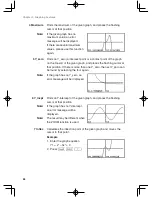
Note: G TYPE appears only when the sequence coordinate graph mode
is selected.
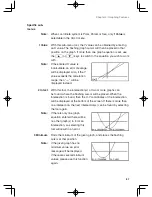
A – – – – – – Displays the current FORMAT settings. The default setting is:
EXPRES ON
(for the graph equation to be displayed on the
graph)
Y’ OFF
(for displaying numeric derivatives on the graph)
AXIS ON
(for displaying the X/Y axis on the graph)
GRID OFF
(for displaying a grid on the graph)
CURSOR RectCoord
(for displaying the cursor location)
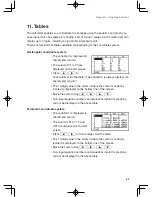
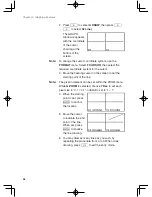
B EXPRES This sets whether or not graph equations are displayed on the graph
screen (in the trace mode, etc.). To not display the equations on the
graph, select
2 OFF by pressing
2
at this menu item.
C Y’ The numeric derivative (dx/dy) can be displayed on the graph screen
(in the trace mode, etc.). To activate this function, select
1 ON by
pressing
1
at this menu item.
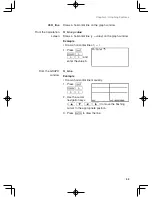
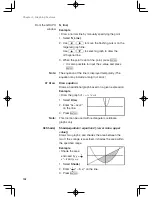
D AXIS The graph axis can be set invisible with this menu item. To hide the
X/Y axis of the graph, select
2 OFF by pressing
2
at this menu
item.
E GRID The graph display can be backed with an X-Y grid. To show the grid
on the graph, select
1 ON by pressing
1
at this menu item.
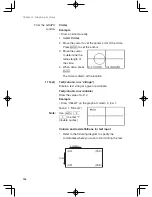
F CURSOR The coordinate system that indicates the location selected by
the trace or other function can be selected from
1 RectCoord
(Rectangular coordinates) or
2 PolarCoord (Polar coordinates) (In
the parametric system, the T indication is added.)
Содержание el-9950
Страница 1: ......
Страница 11: ...10 Chapter 1 Getting Started To open the cover When in use When not in use Using the Hard Cover ...
Страница 266: ......


