13
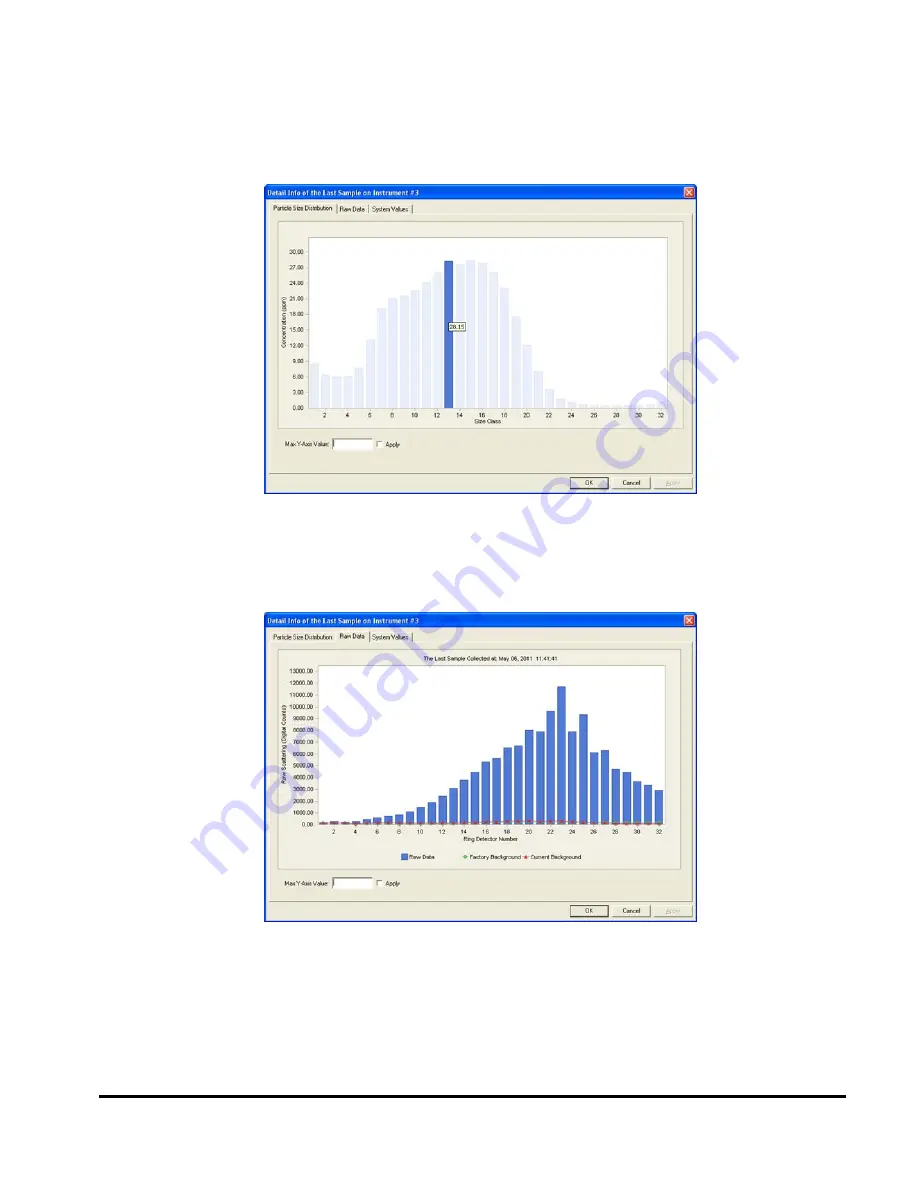
If you are interested in knowing the exact concentration in a size class
you can move the mouse to the blue bar on the size class of interest
and hold it there for a second. The other bars will turn light blue and the
actual concentration in the selected size class will display. In the
example below, the concentration in size class 13 is 28.15 ppm.
Step 13: Display
Raw Data of last
Sample
If you click the Raw Data tab (or select Display Raw Data from the
Display Menu), the uncalibrated raw data from the last sample will
show. This can be useful for troubleshooting and to get an idea of the
signal-to-noise ratio in the sample.
In the Raw Data display, the blue bars show the signal level of the last
sample (in units of digital counts). The green line (circles) is the factory
background and the red line (triangles) is the current background. The
background measurements are always obtained before a sample, using
water from the clean water tank.
Содержание LISST-Hydro
Страница 2: ......
Страница 4: ......
Страница 6: ......
Страница 21: ...15...
Страница 41: ...35 Notes...
Страница 43: ...37 Monitor mode display is very similar to the Master Controller mode display Notes...
Страница 51: ...45...


