


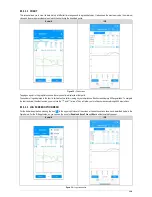
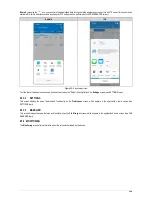


9.5.3.3.2 CHART
This screen allows y
ou to view the data history at different time ranges and in a graphically way. It also shows the maximum value, the minimum
value and the average recorded value of each channel during the download period.
Android
iOS
Figure 29 –
Chart screen
Tapping on a point in the graph lets you see the value and time displayed at that point.
The number of logs d
isplayed in the chart is limited to allow better viewing on your smartphone. Each screen displays 500 acquisitions. To navigate
the chart and view the other records, you must use the
and
arrows. They will allow you to roll back or advance through 500 acquisitions.
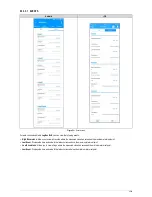
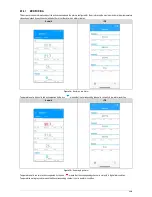
9.5.3.3.3 LOG SCREEN OPTION MENU
For the Android application, pressing the icon
in the upper right corner of the screen will show the options shown and described below in the
figure below. For the iOS application, as you can see, the icons for
Download
,
Save Files
and
Share
will automatically appear:
Android
iOS
Figure 30 –
Log screen option
40/65