RTD Embedded Technologies, Inc.
| www.rtd.com
12
DM35418HR/DM35218HR
User’s Manual
BDM-610010041 Rev F
2.1.1
A
NALOG
I
NPUT
FFT
PLOTS
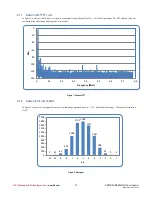
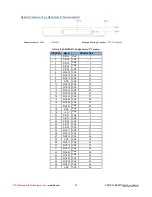
In Figure 1, a coherent 10kHz sine wave signal was attached to input Channel 0 in the +/-10V, Differential mode. The FFT absolute value was
calculated using a Blackman-Hanning three term window.
Figure 1: Channel FFT
2.1.2
A
NALOG INPUT HISTOGRAMS
In Figure 2 you can see a histogram of samples from sampling a grounded input in +/-10 V, differential input range. The number of samples is
131072.
Figure 2: Histogram
-140
-120
-100
-80
-60
-40
-20
0
0
0.1
0.2
0.3
0.4
0.5
0.6
0.7
0.8
dB
FS
Frequency (MHz)
1
12
83
316
1008
1712
1780
1571
1027
388
91
9
2
0
200
400
600
800
1000
1200
1400
1600
1800
2000
-11 -10
-9
-8
-7
-6
-5
-4
-3
-2
-1
0
1
Bin


