


P r i m a L u c e L a b i S r l
S p i d e r 2 3 0 u s e r m a n u a l
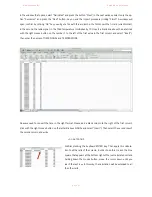
Now, keeping the selection on all the just calculated cells, place the mouse cursor over one of them, press the
mouse right button and select “Cell Format". Select "Time" and confirm with "OK". Cells now show the time in the
UT (Universal Time) format. You can now write also the header of this column as TIME.
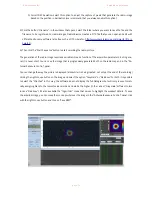
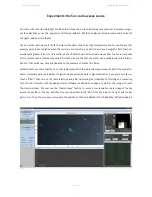
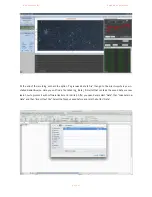
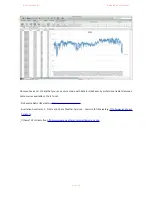
Now select "Insert" then "Chart" then "Line" and then
"Lines". You will see a blank area of the chart, click on it
with the right mouse button and select "Select Data". In
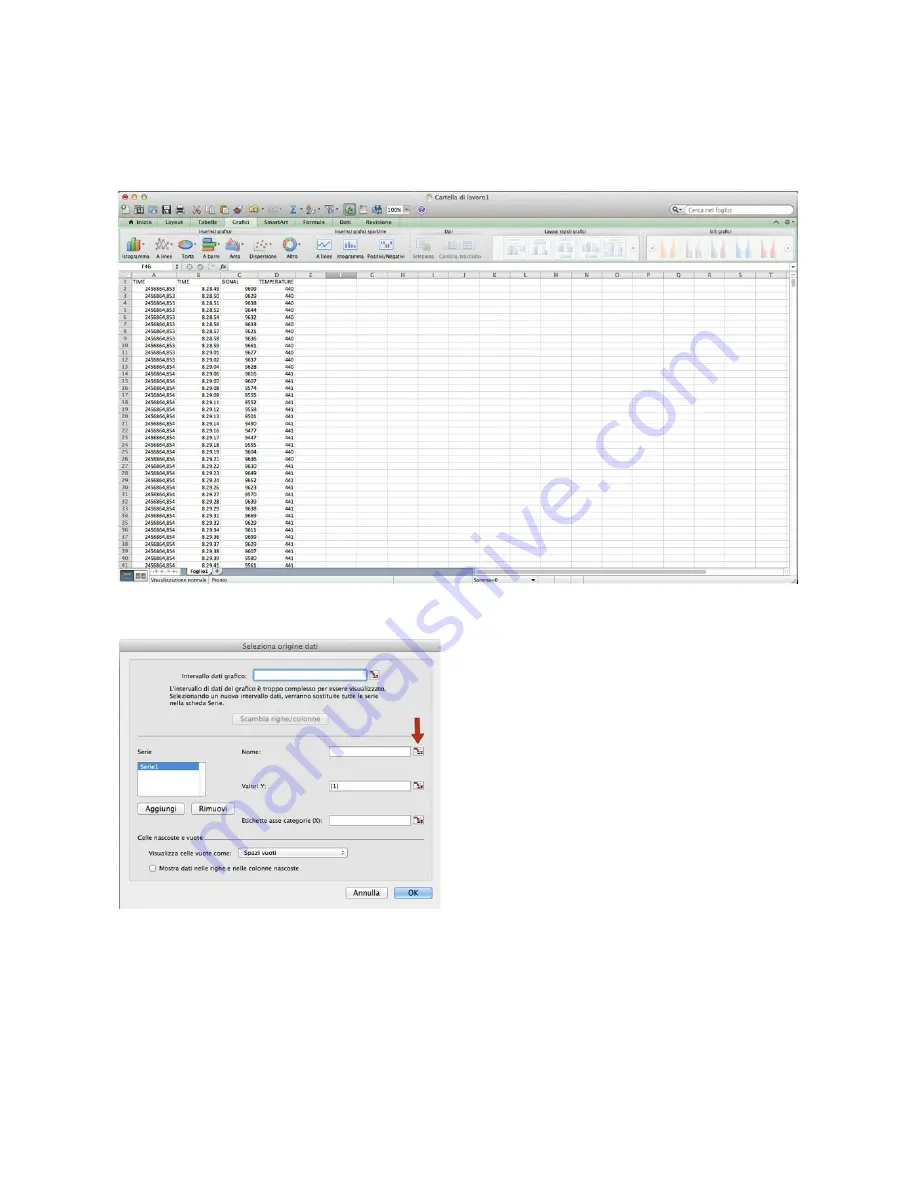
the window that opens, click the "Add" button to add a
new data series. Then press the button to the right of the
“Name” field (indicated by the red arrow in the photo on
the left), the window will become smaller, click on cell C3
(where it is written SIGNAL) and press enter to confirm.
!
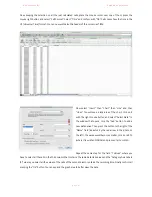
Repeat the same step for the field "Y Values" where you
have to select all the cells in the third column that contains the radio detected values and the "Category Axis Labels
(X)" where you select all the values of the cells of the second column contains the recording time. Finally confirm all
pressing the "OK" button. You can expand the graph area to better view the data.
!
!
p a g e
!
6 7


