LED Measurement System
User Manual
18
Ossila Limited © 2022
I.
If the name is already in use, you will be asked if you wish to overwrite the previous
profile.
II.
The name cannot contain the characters: \
/ : * ? “ < > |
•
The settings profile will be added to the drop-down box using the given profile name.
(II)
Settings Profiles
•
Select a saved settings profile from the drop-down box.
I.
The settings fields will be populated with the saved values from the selected
profile.
•
Settings profiles can be deleted by selecting the profile and then clicking the red ‘delete’
icon next to the drop-down box.
9.3.6
Measurement Controls
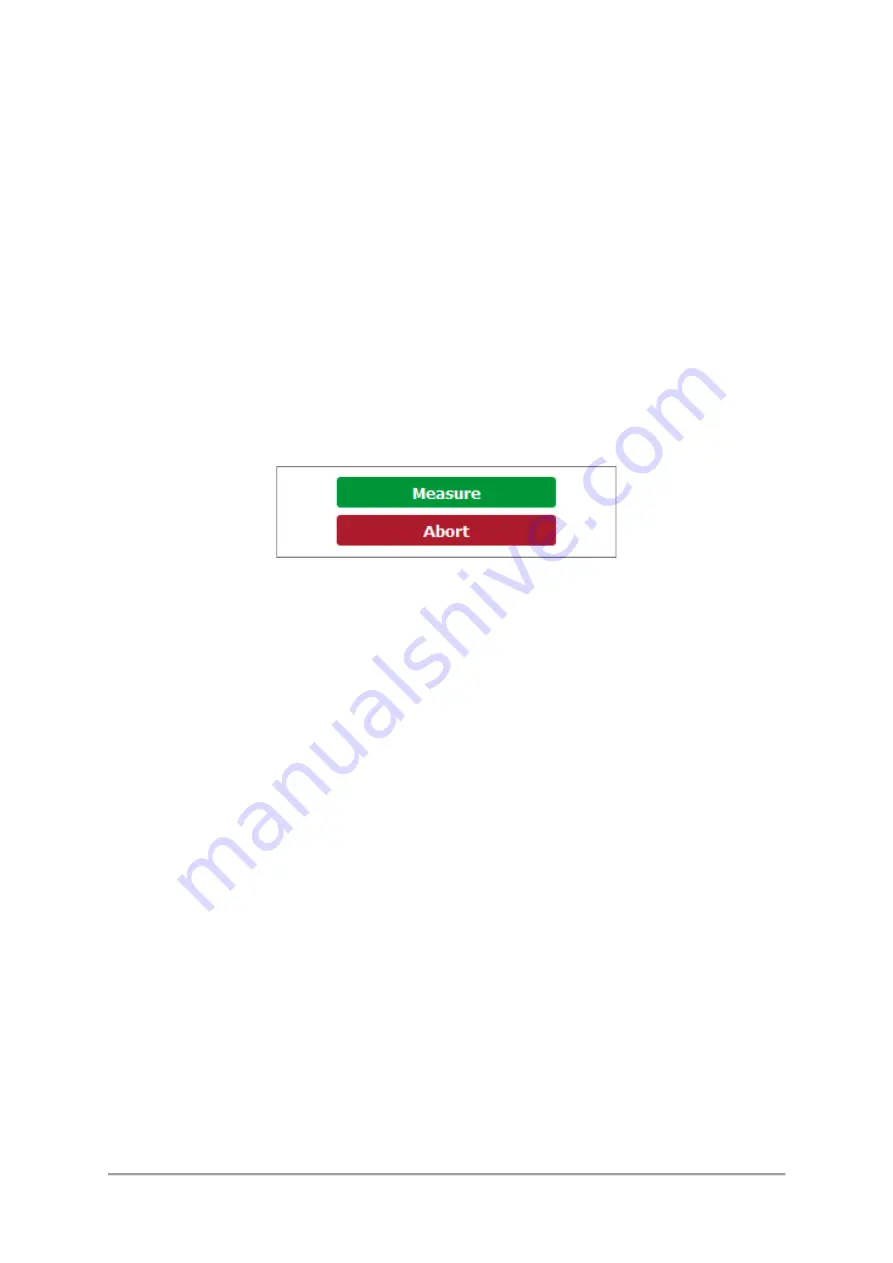
Figure 9.8.
Controls to start and stop the measurement.
(I)
Measure
•
Clicking this button will start the measurement using the chosen settings.
•
This button cannot be clicked if the software has not detected a unit
(II)
Abort
•
Stops a measurement that is currently in progress.
9.3.7
Plot Controls
(I)
Plot Display Controls
By default, the axes of the plot will automatically scale to display all the data within it. The view can
be controlled manually using the following mouse controls:
•
Left/Middle click and drag
–
pan the axes.
•
Right click and drag
–
scale the axes (left-right for x-axis, up-down for y-axis).
•
Scroll wheel
–
scale the axes centred on the cursor location.
A specific axis can be controlled by using these controls on the axis labels. The axes can be reset
by clicking the “Reset View” button shown in
Содержание T2005
Страница 27: ......


