Section 5
– Recorder Setup
Page 56
09/11/2008 REV 0.99
Trends
Trends are the most informative and complex of all the widgets. Trends show multiple channels of data with
respect to time. The user can have multiple trend displays with different combinations of channels. Each
channel can have its own scale or all channels can share the same scale.
Trends are available in vertical or horizontal format. Vertical trend lines move from top to bottom while
horizontal trend lines move from right to left. Vertical trends are available as full size (6 across x 8 down) or
half size (6 across x 4down). Horizontal trends are available as full size (6 across x 8 down), 2/3 size (4 cross
x 8 down) or half size (3across x 8 down). Trends can be used in conjunction with any other widgets on the
display as set up in the
Display Builder
.
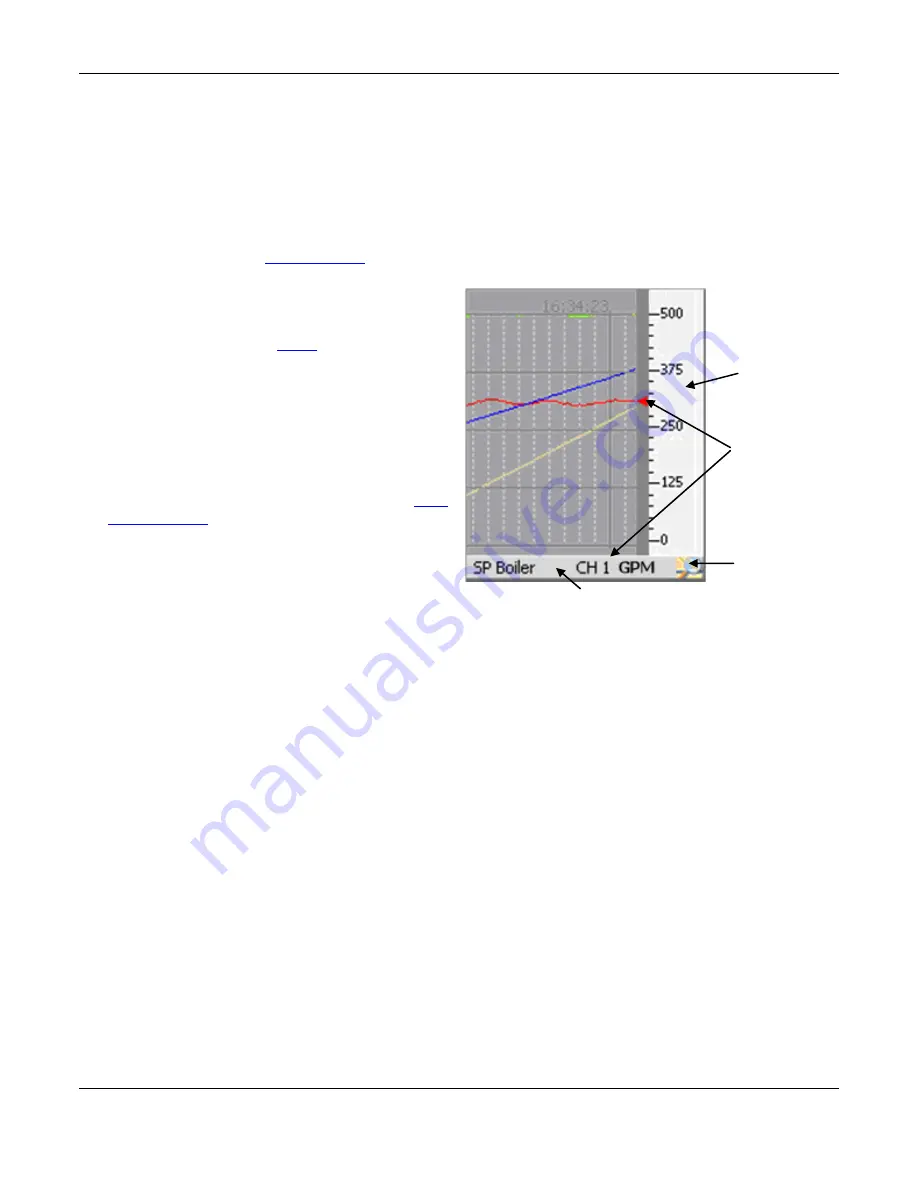
The Trend View has a number of active elements.
The Trend Setup active area is the scale as shown
right. Double tapping this area will pop-up the
Trend Scale Setup
– see
below
.
The name bar below the trend is the Scale Rotate
active area. Tapping this bar will force the scale to
move to that of the next channel. The channel
identifiers show which channel scale is currently
visible and what the engineering units are.
The Browse button on the right of the name bar
below the trend allows the user to go to the
trend
browse screen
. Here the user can scroll through
historic data, zoom, measure, annotate and save
or print images of the trend.
Trends can have up to 18 channels on a display
although this could be extremely cluttered. Since it
is possible to create multiple trend displays, or
even displays with two (half) trends it would be
better to group smaller numbers of channels together on their own display and cycle between them.
Channels on a single trend display can all share the same scale or can each have a separate scale. When
channels have individual scales, the scale on the trend itself will change at a predetermined interval, allowing
each channel scale to “have a turn” for a period of time known as the dwell time. Thus if the dwell time were
10 seconds, every 10 seconds the next scale would appear and the scales would cycle around. As each scale
appears, those trend lines associated with that scale will have pointers to the immediate left of the scale in
horizontal trends or below in vertical trends. This associates the trend line with the scale. The scale rotation
can be stopped and a single scale can be set continuously
– see Trend Setup below.
TREND SETUP
ACTIVE AREA
BROWSE
BUTTON
SCALE ROTATE
ACTIVE AREA
CHANNEL
IDENTIFIERS
Figure 5-3-3 Trend View


