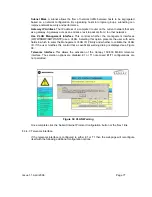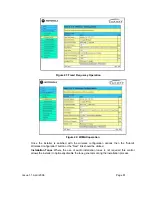
Issue 1.1 April 2006
Page 70
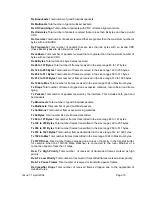
Packets To Internal Stack
This displays the total number of good packets the bridge has
transmitted to the internal stack (e.g. ARP requests, PING requests, HTTP requests). The
number in (+nn) displays the number of packets transmitted since the last page refresh.
Packets From Internal Stack
.This displays the total number of good packets the bridge has
received from the internal stack (e.g. ARP responses, PING replies, HTTP responses). The
number in (+nn) displays the number of packets received since the last page refresh.
Transmit Data Rate
The data rate in the transmit direction, expressed in Mbps and
presented as: max, mean, min, and latest histogram format. The max, min and latest are true
instantaneous measurements, the mean is the mean of a set of one second means.
The histogram is calculated over a one hour period. If the equipment has been running for
less than one hour then the histogram is calculated over the current elapsed time. Expected
data rates can be found in section 4.1.4 “Aggregate Ethernet throughput rate v maximum link
loss”. The data used to compute the histogram statistics can be downloaded in an ASCII
comma separated variable (CSV) format via the download diagnostics page, see section
6.3.10.
Receive Data Rate
The data rate in the receive direction, expressed in Mbps and presented
as: max, mean, min, and latest histogram format. The max, min and latest are true
instantaneous measurements; the mean is the mean of a set of one second means.
The histogram is calculated over a one hour period. If the equipment has been running for
less than one hour then the histogram is calculated over the current elapsed time. Expected
data rates can be found in section 6.1.4 “Aggregate Ethernet throughput rate v maximum link
loss”. The data used to compute the histogram statistics can be downloaded in an ASCII
comma separated variable (CSV) format via the download diagnostics page, see section
6.3.10.
Aggregate Data Rate
The sum of the data rate in the both direction, expressed in Mbps and
presented as: max, mean, min, and latest histogram format. The max, min and latest are true
instantaneous measurements; the mean is the mean of a set of one second means.
The histogram is calculated over a one hour period. If the equipment has been running for
less than one hour then the histogram is calculated over the current elapsed time. Expected
data rates can be found in section 6.1.4 “Aggregate Ethernet throughput rate v maximum link
loss”. The data used to compute the histogram statistics can be downloaded in an ASCII
comma separated variable (CSV) format via the download diagnostics page, see section
6.3.10.
Link Capacity
The maximum aggregate data capacity available for user traffic under the
current radio link conditions assuming the units have been connected using Gigabit Ethernet.
The sum of the displayed Transmit and Receive data rates may be lower than this figure if the
link isn't fully loaded by the current traffic profile.
Transmit Modulation Mode
The modulation mode currently being used on the transmit
channel. The number in brackets after the modulation mode and coding rate string is the
effective data rate available to all MAC layer protocols. Details on the modulation modes can
be found in section 11.1 “System Specifications”. The data used to compute the histogram
statistics can be downloaded in an ASCII comma separated variable (CSV) format via the
download diagnostics page, see section 6.3.10
Receive Modulation Mode
The modulation mode currently being used on the receive
channel. The number in brackets after the modulation mode and coding rate string is the
effective data rate available to all MAC layer protocols. Details on the modulation modes can
be found in section 11.1 “System Specifications”. The data used to compute the histogram
statistics can be downloaded in an ASCII comma separated variable (CSV) format via the
download diagnostics page, see section 6.3.10
Содержание Canopy 150 Mbps Backhaul
Страница 1: ...Canopy 150 300 Mbps Backhaul User Guide BH150 300 UG en Issue 1 1 April 2006 ...
Страница 25: ...Issue 1 1 April 2006 Page 24 Figure 5 Canopy 150 300 PIDU Power Input ...
Страница 66: ...Issue 1 1 April 2006 Page 65 Figure 29 Save and Restore Configuration Page Figure 30 Save File Pop up ...
Страница 97: ...Issue 1 1 April 2006 Page 96 Figure 59 Spectrum Management Help Page ...
Страница 162: ...Issue 1 1 April 2006 Page 161 Figure A8 Surge Arrestor ALPU ORT Connection Illustration ...
Страница 167: ...Issue 1 1 April 2006 Page 166 Figure 113 64 QAM 0 92 Dual Payload Figure 114 256 QAM 0 81 Dual Payload ...


