miniDSP Ltd – Hong Kong /
www.minidsp.com
/ Features and specifications subject to change without prior notice
29
5.2.2
Editing the target curve
You can edit the target curve to set any desired magnitude response (see
Guidelines for target curve design
).
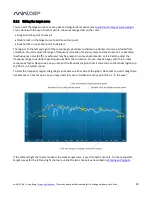
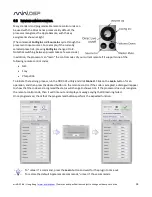
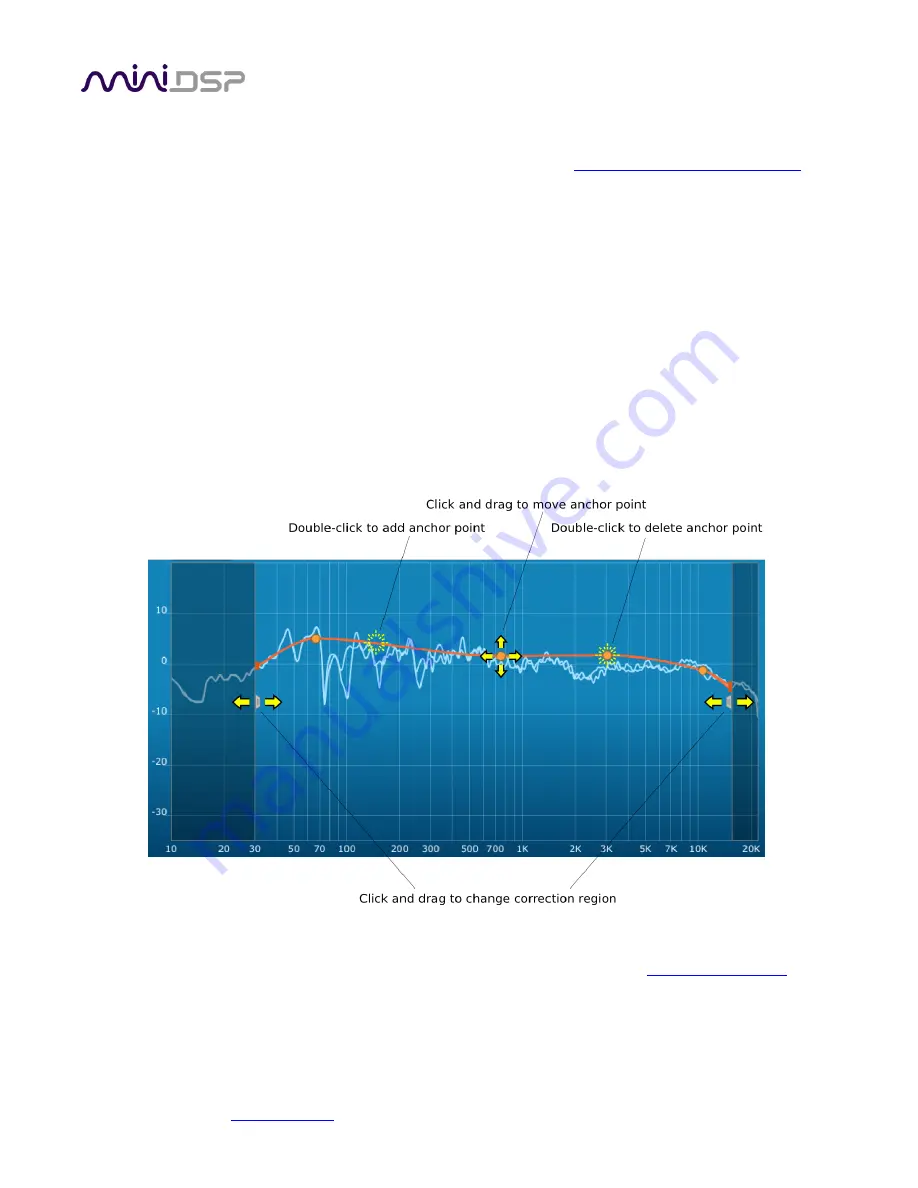
This is done with the use of anchor points, shown as orange dots on the curve:
Drag an anchor point to move it.
Double-click on the target curve to add an anchor point.
Double-click on an anchor point to delete it.
The regions to the left and right of the response graphs that are shaded in a darker color are excluded from
correction. You can adjust the range of frequency correction for your system and environment. For example,
low-frequency noise (traffic, machinery) may be present in some environments, so it is best to adjust the
frequency range to exclude these frequencies from the correction. Or, you may be happy with the in-room
response at higher frequencies, so you can set the frequency region to limit correction to the modal region (up
to 300 Hz, in a typical room).
To alter the frequency region, drag the grey handles on either side of the graph. Note that you can’t drag these
handles over an anchor point, so you may need to move or delete an anchor point that is “in the way.”
If the left and right channels are linked, the same target curve is used for both channels. To create separate
target curves for the left and right channels, unlink the two channels as described in
Working with graphs
.


