■■■■■■■■■■■■■■■■■■■■■■
3 Overview of the software
■■■■■■■■
13
5.
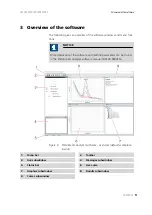
Display of time, potential and current related to the voltammetric
measurement.
Live curve
Live display of the currently measured voltammogram.
Subwindow in the
Default workplace
and
Mosaic workplace
layout.
In the
Tabs workplace
layout it is found in the
Curves
subwindow as
separate tab.
Graphics subwindow
Display of color and name of the curves belonging to the currently run-
ning or loaded determination. In this subwindow, the curves have to be
selected for which name, color or visibility should be changed. Also for
individual export the curves have to be selected in this subwindow.
Results subwindow
This subwindow includes 2 to 5 tabs. The tab
Results
shows the overview
of the results calculated for all substances specified in the method. Evalua-
tion details, like peak potentials and peak heights can be found on up to 4
additional tabs. One tab for each substance, tagged with
'Substance
name'
.
Curves subwindow
This subwindow includes maximum 6 tabs. The tab
Curves
shows all vol-
tammograms belonging to the determination. Calibration curves for each
substance can be found on up to 4 additional tabs. One tab for each sub-
stance, tagged with
'Substance name' calibration
. In the
Tabs work-
place
layout one additional tab
Live curve
is displayed in this sub-
window.
Содержание 2.946.0010
Страница 1: ...946 Portable VA Analyzer 2 946 00x0 Manual 8 946 8003EN ...
Страница 2: ......
Страница 8: ......
Страница 12: ...1 4 Symbols and conventions 4 Note This symbol marks additional information and tips ...
Страница 79: ... 8 Technical specifications 71 8 8 Connection Connection USB version 1 1 or higher ...


