6
Monitoring SAN Router Operation and Connections
6-23
Viewing Statistics
2. Click the
Options
button to display the
Chart Options
dialog box
(
Figure 6-18
on page 6-23).
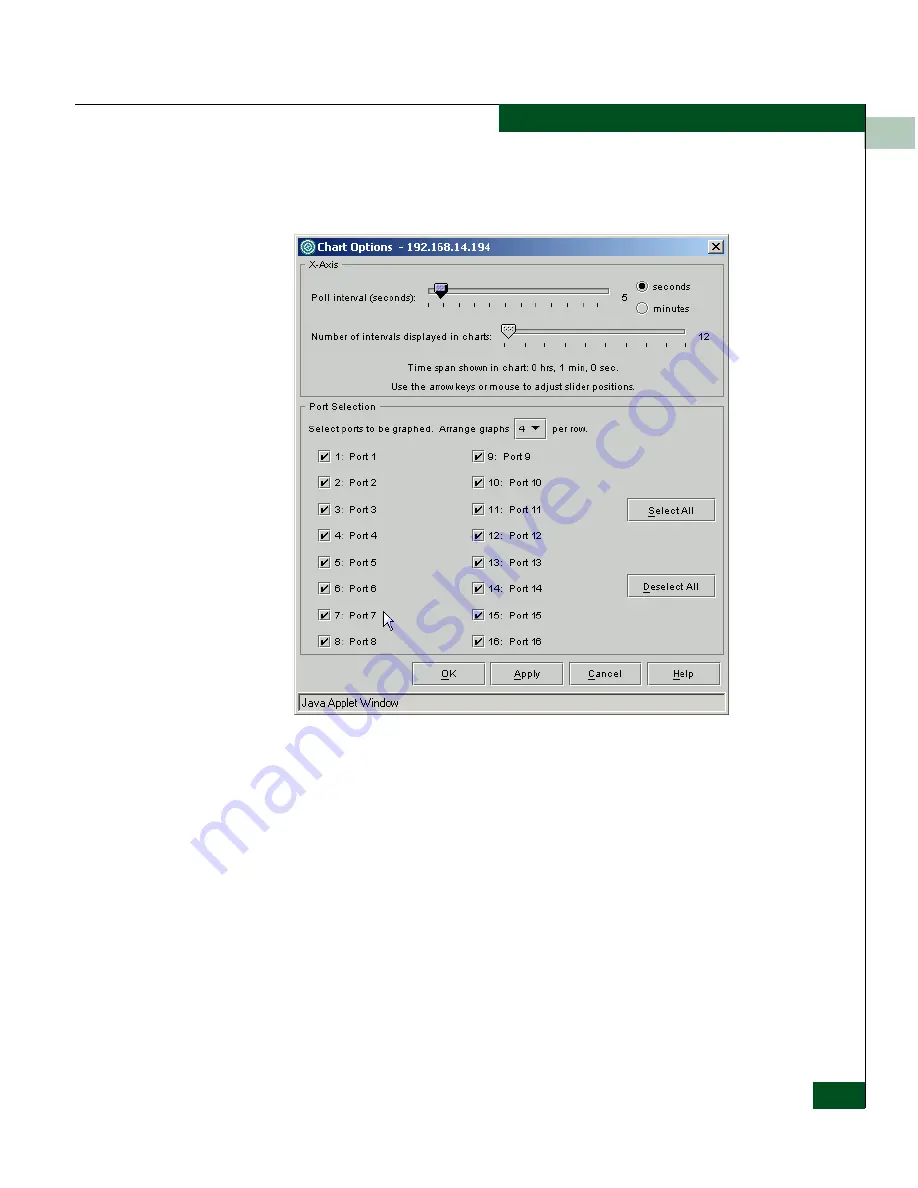
Figure 6-18
Chart Options Dialog Box
3. Click
seconds
or
minutes
, then use the arrow keys or mouse to
adjust the slide bar to change the poll interval and the number of
intervals to be displayed in each graph on the
Port Traffic Report
.
4. Select the ports to be included in the report.
5. Select the number of graphs to be displayed per row (1 to 4) from
the drop-down list.
6. Click
Apply
.
If cookies are enabled in the web browser, the chart options are saved
and re-used each time Element Manager is started.
Содержание Eclipse 2640 SAN
Страница 1: ...Eclipse 2640 SAN Router Administration and Configuration Manual P N 620 00203 020 REV A...
Страница 10: ...x Eclipse 2640 SAN Router Administration and Configuration Manual Figures...
Страница 18: ...xviii Eclipse 2640 SAN Router Administration and Configuration Manual...
Страница 108: ...4 4 30 Eclipse 2640 SAN Router Administration and Configuration Manual Example Configurations and Procedures...
Страница 186: ...6 6 38 Eclipse 2640 SAN Router Administration and Configuration Manual Viewing Statistics...
Страница 202: ...7 7 16 Eclipse 2640 SAN Router Administration and Configuration Manual Retrieving and Clearing the System Log...
Страница 210: ...8 8 8 Eclipse 2640 SAN Router Administration and Configuration Manual SAN Router Troubleshooting...
Страница 276: ...Eclipse 2640 SAN Router Administration and Configuration Manual i 4 Index...


