33
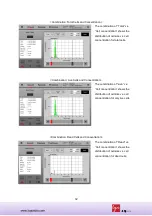
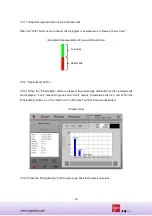
3.5.1.1 Graphical representation of live and dead cells
When the “Total” button icon is clicked, the histogram is expressed as a “
Stacked Column Chart.”
<Graphical Representation of Live and Dead Cells>
Live cells
Dead cells
3.5.2
“
Cluster Map” button
3.5.2.1 When the “Cluster Map” button is pressed, the percentage distribution of the clustered cells
are displayed. “1-cell” means single cell and “2-cell” means 2 clustered cells as a unit. When the
“Cluster Map” button is on, the “Total” and “Cell Number” buttons become inactivated.
<Cluster map>
3.5.2.2 Press the “Graph/Gating” button again to go back to the previous screen.

