72
Chapter 7 - TV Measuring Range
106 V3.2
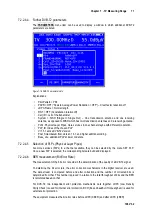
Both values are shown on the display in exponential form.
The depth of measurement for the CBER is1•10
6
bits, for the LBER it is 1•10
8
bits.
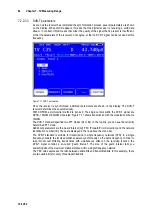
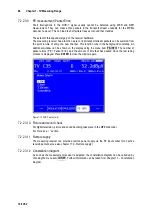
MER measurement (Modulation Error Rate)
7.2.2.4.7
In addition to measure the bit error rate, it is established practice with digital transmission to also
measure MER. It is defined in ETR290. MER is calculated from the constellation points.
It is the counterpart to S/N measurement with analogue transmission methods. The measuring
range goes up to 35 dB with a resolution of 0.1 dB.
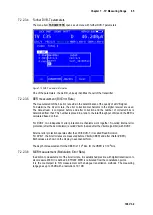
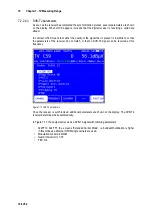
Noise Margin (NM)
7.2.2.4.8
In case of white noise a limit value of MER for the minimum signal quality (QEF) can be determined
dependent on the modulation type and the FEC.
The difference of MER to this limit value corresponds to the system reserve NM (noise margin).
Just as MER it is displayed in dB with a resolution of 0.1 dB. For an easier assessment of the
signal quality the NM is shown in the colors red for bad, yellow for limited and green for good signal
quality. The limit values for the BER (>2e-4 for bad and <1e-6 for good) will also be included in this
assessment.
Important! The noise margin cannot be shown in DVB-T2 during active PE-measurement.
Impulse response
7.2.2.4.9
As with DVB-T, DVB-T2 is intended for operation in a single frequency network. This means
several transmitters transmit on the same frequency.
The transmitters involved must operate synchronously on the same frequency.
The maximum transmitter distance depends on the Guard Interval used.
At the receiving location, the signals from individual transmitters superimpose on each other to form
a sum signal.
The result can be constructive or destructive depending on the transit time difference and the
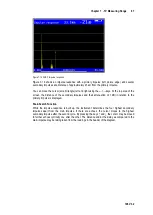
received field strength. The impulse response graphically represents attenuation and transit time
difference of the individual signals.
In order to calculate the channel impulse response, the DVB-T2 receiver requires information on
the channel transmission function. The demodulator obtains this information by evaluating the pilot
carrier in the OFDM signal.
The measuring receiver must receive a DVB-T2 signal in order to measure the impulse response.
The instrument should be tuned to an appropriate channel to do this.
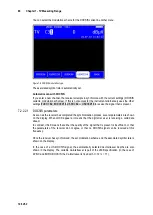
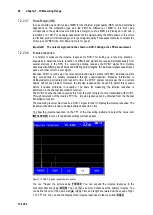
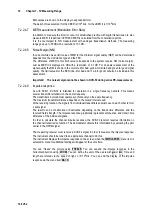
The instrument displays the impulse response on the screen when the
IMPULSERES
menu item is
selected. A menu for additional settings will appear at the same time.
You can “freeze” the picture using
FREEZE
. You can expand the impulse response in the
horizontal direction using
ZOOM
. You can define the unit of the x-axis with
µs
or
km
. Time and
length are related via the speed of light, c:=3•10
8
m/s. You can end the display of the impulse
response via the menu item
BACK
.

