CVS-702D
Chapter 2 Basic operation
0093107022-02
2-15
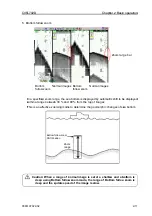
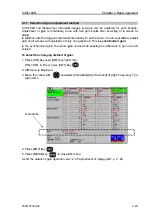
2.1.4 Display of mixed images
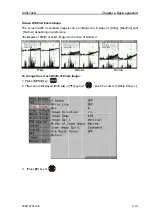
Mixed images are combination of high and low frequency images by signal processing. The
main purpose is to identify small fish, such as whitebait, from other fish school.
For example, when high frequency is 200 kHz, the wavelength of underwater acoustic wave is
0.75 cm, and when low frequency is 50 kHz, the wavelength of underwater acoustic wave is
3.0 cm. In the image of low frequency 50 kHz, fish smaller than 3 cm is hardly detected.
As school of small fish such as whitebait is clearly displayed in high frequency signal with
short wavelength, only school of small size fish is displayed in warm color from red to
greenish yellow in fish school mode.
By this, it is easy to identify smaller size than 3.0 cm.
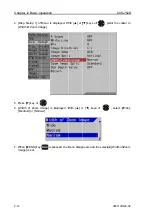
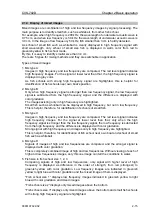
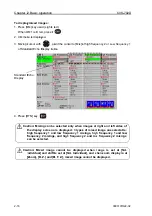
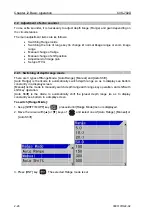
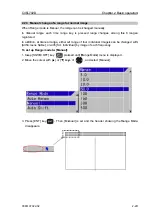
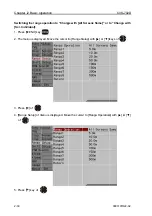
There are 5 types for mixing methods and they are switchable in application.
Types of mixed images:
1. Mix type A
Images in high frequency and low frequency are compared. The red level signal indicates
high frequency images. For the signal at lower level than that, the high frequency signal is
displayed in gray color.
As fish schools with strong high frequency signal are highlighted, this is helpful for
identification of fish schools near own boat’s position.
2. Mix type B
Only when high frequency signal is stronger than low frequency signal, the low frequency
signal is subtracted from the high frequency signal, and the difference is displayed with
color gradation.
The images existing only in high frequency are highlighted.
Small fish such as whitebait can be displayed in high frequency, but not in low frequency.
This is helpful, therefore, for identification of schools of small fish.
3. Mix type C
Images in high frequency and low frequency are compared. The red level signal indicates
high frequency images. For the signal at lower level than that, only when the high
frequency signal is stronger than the low frequency signal, the low frequency is subtracted
from the high frequency and the difference is displayed with color gradation.
Strong signal with high frequency and images only in high frequency are highlighted.
This is helpful, therefore, for identification of fish school near own boat and school of small
fish such as whitebait.
4. Mix type D
Signals of images of high and low frequencies are compared, and the stronger signal is
displayed with color gradation.
This is completely combined image of high and low frequencies. Without viewing of each of
high and low frequencies images, only this one image can tell the conditions in water.
5. Fish size in fish school size 1, 2, 3
Comparing signals of high and low frequencies, only signal with higher level of high
frequency is displayed as difference in the order of strength, from red (strongest) to
greenish yellow with color gradation. Low frequency images are indicated in greenish
yellow to light blue with color gradation and the mixed image of them is displayed.
“Fish school size 1” displays low frequency images indicated in greenish yellow to light
blue with color gradation and mixed images.
“Fish school size 2” displays only mixed images above the bottom.
“Fish schools size 3" displays only mixed images above the bottom and small fish schools
with strong high frequency signal are highlighted.
Содержание CVS-702D
Страница 1: ......
Страница 2: ......
Страница 4: ......
Страница 12: ... This page intentionally left blank ...
Страница 28: ...Chapter 1 Preparation CVS 702D 1 16 0093107022 02 This page intentionally left blank ...
Страница 114: ... This page intentionally left blank ...
Страница 126: ...Chapter 3 To make the best of CM keys CVS 702D 3 12 0093107022 02 This page intentionally left blank ...
Страница 140: ...Chapter 4 Useful operation CVS 702D 4 14 0093107022 02 This page intentionally left blank ...
Страница 144: ......

