


ManagerIQEasy_UM_9752103002_GB_V3_1
38
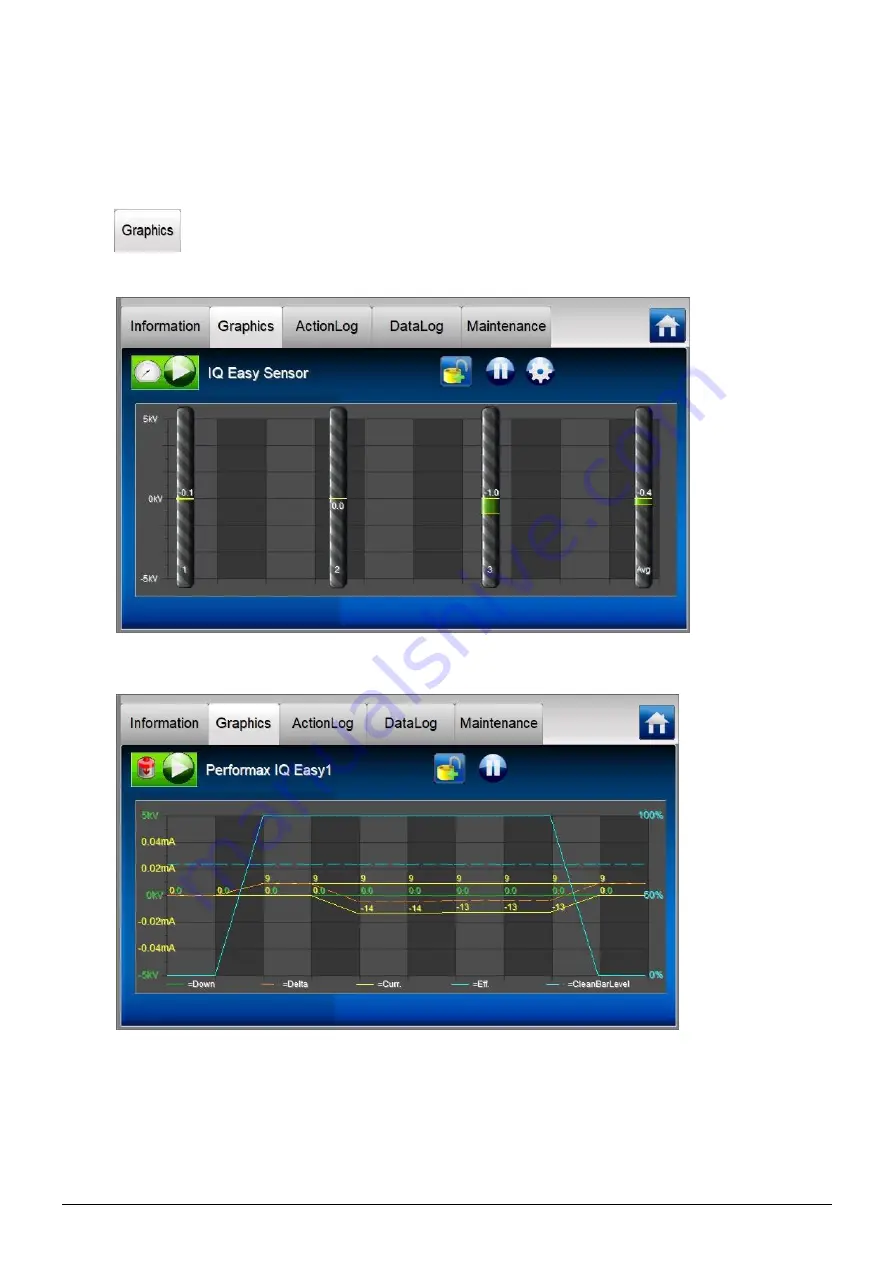
6.11.2 Tab “Graphics”
The “
Graphics
” screen graphically displays the operation of the Device. The graph shows
important measured values in relation to time, in the case of a Sensor, the current measured
values. In the key it is made clear what the representation of each coloured line is.
Press
(Graphics) to display the graphical display. For a Sensor IQ Easy the screen
looks like this:
For a Performax IQ Easy the screen looks like this (note: the display will differ per Device).
The c
urrent display can be ‘frozen’ or stopped by pressing anywhere on the graph field. The text
“
On hold
” then appears on the screen. By pressing the graph field again, the text “
On Hold
” will
disappear and the current values will be displayed again.
The spee
d at which the graphical screen is updated is set using the Device parameter “
Graphic
refresh time
”. By default, this is set to 1 second. See Section 6.12 on how the parameter can
be changed.