


eZ-Analyst
988191
Interactive Plot Display 6-1
Interactive Features of the Plot Display Window
6
Introduction ……6-1
Adding and Removing Channels …… 6-1
Using Cursors …… 6-2
Additional Functionality …… 6-6
Copy …… 6-6
Strip Charts…… 6-7
XLS Overlay …… 6-8
Displaying Channel Pairs …… 6-10
Changing the Display Range ….. 6-10
Changing Format, Scale, and Grid …… 6-12
Introduction
To change a plot’s display characteristics; it must be the “focus plot.” For focused plots you
can use toolbar buttons [listed in the following table]; or use the mouse or key commands to
make changes to the way in which the data is displayed.
Focus can refer to the window that is in focus, as well as to a plot that is in focus.
When
multiple plot windows are open, one is always the “
focus window
.” When a window does not
have focus, its title bar is dimmed.
To change the “focus window,” simply click on title
bar of the window of interest.
Clicking the “Graph Toolbar” button will bring up a buttons toolbar, which provides a means of
quickly implementing various plot display functions. An alternative to using the buttons is to
“right-click” in a plot display, then use the resulting function menu. When the graphic toolbar
is open, clicking the button again will close it. The buttons are identified and explained in the
chapter section entitled
Using the Toolbar Buttons
.
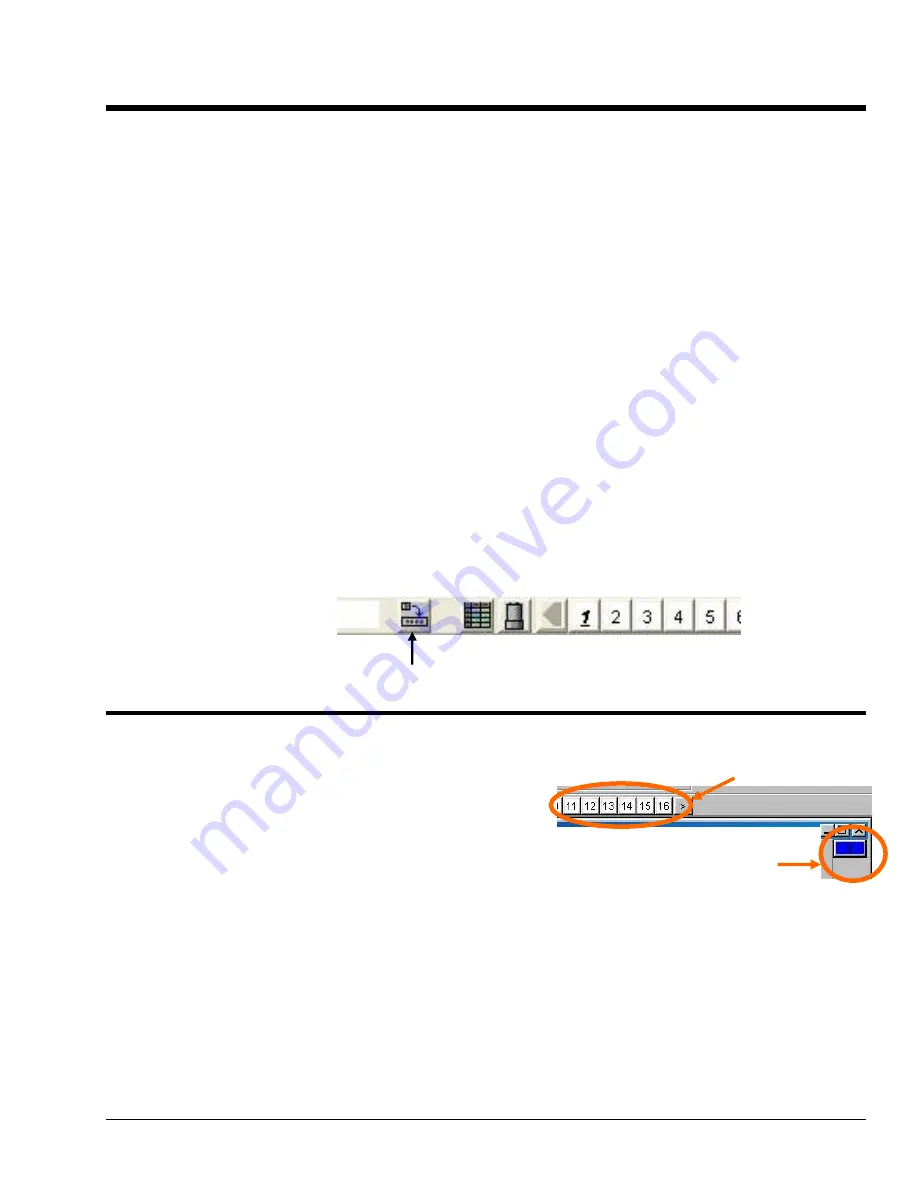
Graphic Toolbar Button
Adding and Removing Channels
To add a channel to a plot . . .
With your mouse, click and drag a white
channel box
into the plot area.
To remove a channel from a plot . . .
With your mouse, click and drag a
channel
box
from the
right of the plot
into the plot
area.
To ADD a channel, click-on the desired
“channel box” and drag it into the plot region.
To REMOVE a channel, click on the
desired “channel box” in this area
and drag it into the plot region.


