9
The Main window
Introduction
We now assume that your network connection works and you are ready to take a
short tour of your screen to get an explanation of what you see and what you can do.
The things explained are independent of the kind of network connection you use -
you can even go through this tour if you have not connected anything to the PC.
Description
The background picture is a borehole with an SQE pump, pipes, power cables and a
CU 300 unit.
The picture is interactive, and the animated water flow in the picture will give you a
visual feedback of the system response to your control actions. Clicking on the ob-
jects marked with arrows will open windows showing status values from the system
or give you control buttons to operate the system. Interactive objects or zones in the
picture are called Hot Spots. When you position the mouse pointer on top of one of
them a yellow Hint Label will explain what the Hot Spot can be used for.
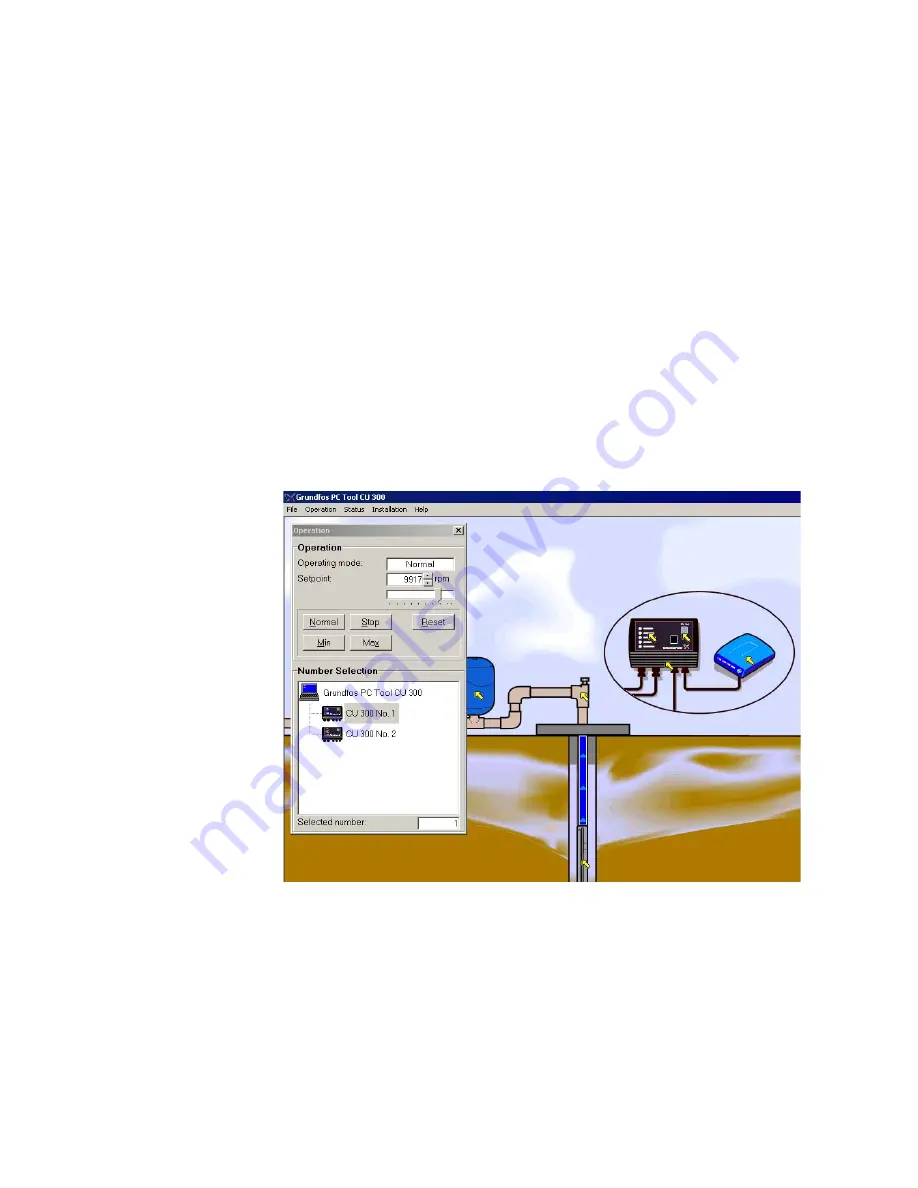
The Operation window is always opened automatically when the tool is started. It
shows you an overview of the network connected to your PC with the connected
units displayed as small icons. This is called the Network List.
The Operation window below shows a situation where the ‘Connection type’ is
‘GENIbus/RS-232’ and there are two CU 300 units connected.
The drawing of the Network List in the Operation window will show the CU 300 icons
connected via a G100 icon if ‘Connection type’ G100 has been selected.
Fig. 3
Screen image example when starting the tool with the Standard Tool Setup and a con-
nection to GENIbus. In this example two CU 300 units are connected to GENIbus
Further information
If more than one CU 300 unit is connected, which is possible using GENIbus or
G100, the tool automatically picks one of them to be the Active Unit. The Active Unit
is the one you interact with. You change to another unit by clicking on its icon.
At the top of the tool screen you see the Menu Bar. This bar has drop down menus
which give you access to all tool windows. An overview of the complete Menu Bar
contents can be seen in section Overview of tool menus, page 11.
At the bottom of the tool screen, just above the Windows Task Bar is the Status Bar.
This bar shows miscellaneous status information of the tool itself and the network
connection. This can often give a hint to the solution of problems if the tool is not ac-
ting as expected.
TM0
1
85
03 08
02
Содержание PC Tool CU 300
Страница 1: ...Installation and operating instructions GRUNDFOS INSTRUCTIONS...
Страница 2: ...2...