44
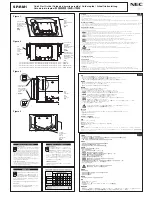
6.13 Histogram
Click shortcut key , and the following interface will appear.
All: Show all BP data statistics.
Day: Show only daytime statistics.
Night: Show only nighttime statistics.
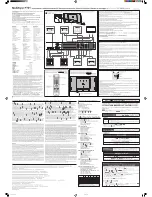
6.14 Pie Chart
Click shortcut key , and the following interface will appear.
The interface is divided into four areas. The most left area is maximum,
minimum, and average value. The second area is pie chart. The third area
Figure 48
Histogram
Figure 49
Pie Chart