background image

6  


Functional Description of Data Logger

The data logger software is designed for configuring and 

monitoring Genvex devices. The data logger can be 

connected to all Genvex Optima control systems.  

The instructions presuppose a correct and  

functioning setup of the software. 

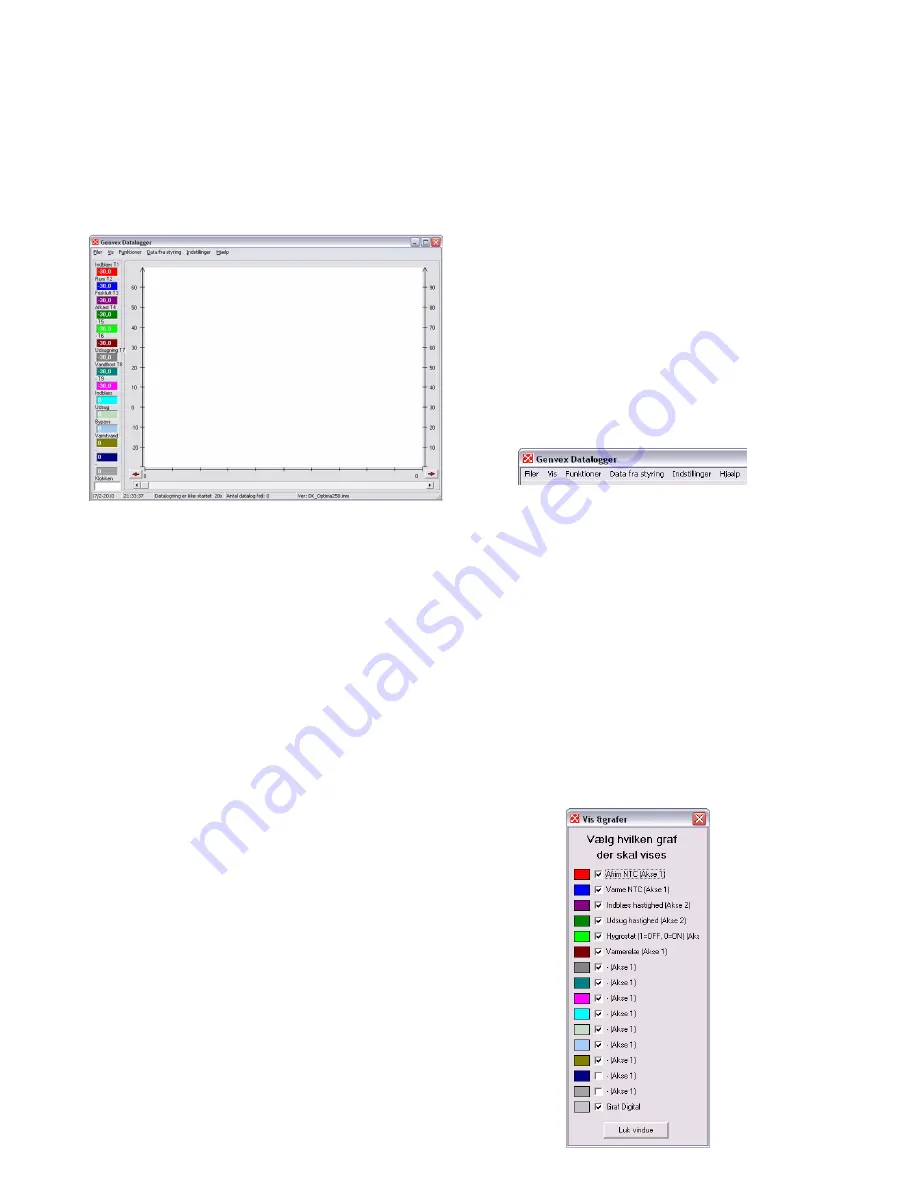
The user interface in Genvex Data Logger

The data logger can be used for several different purposes:

Setup of parameters in the control system.

Setup and changes to the clock program in the control system.

Reading of the data logger in the control system for the 

past three years.

“Live” logging of the current operation of the device.

Subsequent analysis of the operation of a device.

User interface

The program is structured with the primary image in the 

middle of the screen. This is where the graphs that 

represent the information collected from the control 

system are displayed. The menu line for the various 

settings is placed at the top.

Values that are read “here and now” or values that lie below 

the read line are displayed on the left side. The red line 

appears when you click a random place on the display.  

The figures in the left column will then represent all the 

values that lie on the line. The colours of the curves in the 

logging area correspond to the colours displayed on the 

left-hand side. The exact time of logging will be displayed 

in the field at the very bottom.

Tip: Click on the clock field to change the field to display 

“LOG NO.”. This can be useful if you want to refer to a 

certain logging.

There is an area with grey and white lines at the top of the 

logging area itself on the screen. These lines will be red if 

relay function is active. Hold the mouse cursor over  

the line for a moment, and a small help text will appear.

The left y-axis is a scale for temperatures. The right-hand 

side of the logging area is the scale for percentages, e.g. 

for fan speeds. The x-axis represents the time line.

A logging can contain a good many pages. This is why 

there is a page number in the right/left corner next to the 

red arrows. To flip between pages, click the red arrows.

Press and hold the left mouse button for a moment over 

the red arrow to open a dialogue box. Here you can enter 

the page number you want to scroll to.

There is a status menu located at the bottom of the 

screen. This line displays the date and time, if the data 

logging has started or stopped, the number of data log 

files and which control system the software is  

configured for (this is changed in “Settings”).

Menus

Files

Retrieve data*

 – Retrieves data saved previously on the hard drive (.txt files)

Import of SD card files* – Imports data saved on the 

Optima Design control panel (.dal files)

Save data – Saves the current logging

Save window – Saves only the current window

Save data Excel – save the data to comma separated 

value file

Print – Prints the current window

Exit – Exits the software

*The data logger works with .txt files, whereas the control panel works 

with .dal files.

View

View graphs – Opens a check box. This provides the 

opportunity to select or deselect the graphs displayed  

on the screen, usually to provide an overview.

Содержание ECO 190

Страница 1: ...OPERATING INSTRUCTIONS OPTIMA 260 ECO 190 ECO 375...

Страница 2: ...TENTS 1 Installation of Optima 100 Design 3 2 Installation of Optima 100 Opus 4 3 Operation 5 4 Data Logger 5 5 Genlog Set Points 9 6 Function 16 7 Maintenance 17 8 Troubleshooting 18 9 Table of Facto...

Страница 3: ...point Support point Underneath the control panel there is access for the A Terminal block Connection to main circuit board Fit a 8 x 0 25 mm2 low current cable between the unit and the control panel T...

Страница 4: ...able between the ventilation unit print circuit board and the control panel The maximum cable length is 50 m The voltage drop for cable lengths over 50 m is too high and can cause operating errors Che...

Страница 5: ...in order to take advantage of the automatic data logging feature The latest version of the Genvex Genlog software can be ordered from Genvex by telephone 45 73532700 1 2 3 4 K3 K5 All Genvex ventilati...

Страница 6: ...seful if you want to refer to a certain logging There is an area with grey and white lines at the top of the logging area itself on the screen These lines will be red if relay function is active Hold...

Страница 7: ...or monitoring only Data from Control System Set points in control system Opens the following box Here it is possible to retrieve all set points from the microchip or control panel change them and then...

Страница 8: ...for the data logger General setup Here you can choose language model as well as folder for the log files For instance it can be a good idea to create a folder for logs under Documents and set up the p...

Страница 9: ...ay These days can be filled in individually in the same way as under the example for Monday User menu 01 Temperature Set your desired temperature between 10 and 30 C Item 19 of the Service menu allows...

Страница 10: ...or energy consumption or unpleasant indoor climate Setting option between 0 and 100 11 Level 2 Supply air Level 2 is the recommended speed of the system for providing optimal indoor climate It should...

Страница 11: ...ith on off bypass e g ECO190 ECO 375 The bypass opens when the temperature reaches the set point in User Menu item 1 the temperature differential set in this menu item Setting option between 1 and 10...

Страница 12: ...mper from opening at low outdoor air temperatures and from blowing cold unheated air into the dwelling use this function to configure the lowest outdoor air temperature at which the damper must be clo...

Страница 13: ...n 1 25 13 35 Humidity regulating frequency Setting of desired frequency for how often the fan speed may be changed The function is defined as 1 per unit of time When humidity regulation is activated t...

Страница 14: ...to maintain a supply temperature of 18 C 41 Reheat PI P P band for the PI controller for the electrical modulating reheater The P band controls the amplification of the controller following a deviati...

Страница 15: ...rs Minutes Speed Red T2 1 2 3 4 5 6 7 8 9 10 Thursday Hours Minutes Speed Red T2 1 2 3 4 5 6 7 8 9 10 Sunday Hours Minutes Speed Red T2 1 2 3 4 5 6 7 8 9 10 Tuesday Hours Minutes Speed Red T2 1 2 3 4...

Страница 16: ...sion For systems with electrical reheaters the reheater will connect when the temperature has fallen 1 C below the set temperature If the regulation time is set to e g 3 minutes temperature sensorT1 w...

Страница 17: ...runs off freely If the condensation drain does not work this could lead to water damage at your home Heat exchanger Inspect the heat exchanger every year If it is dirty remove it and Alu exchanger Was...

Страница 18: ...gram Filter timer has switched the system off Condensed water is leaking from the unit Possible error Condensation outlet blocked by dirt The condensation outlet is not adequately protected against fr...

Страница 19: ...ing 3 C 15 0 C 21 Bypass open 3 C 1 10 C 22 Regulation water 20 sec 1 250 sec 23 Regulation electricity 3 min 1 30 min 24 Frost reduction 0 C 0 10 C 25 Frost protection OFF ON OFF 26 Frost protection...

Страница 20: ...t home and in society as a whole a Genvex system actually allows you to recover up to 95 of the heat energy All Genvex systems have energy label A An original Genvex system is built by skilled experie...

Отзывы: