Animated Tide and Current Indicators
WARNING
Tide and current information is for information purposes only. It is your responsibility to heed all posted
water-related guidance, to remain aware of your surroundings, and to use safe judgment in, on, and around the
water at all times. Failure to heed this warning could result in property damage, serious personal injury, or death.
NOTE: This feature is available with premium charts, in some areas.
You can view indicators for animated tide station and current direction on the Navigation chart or the Fishing
chart. You must also enable animated icons in the chart settings (
).
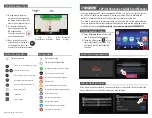
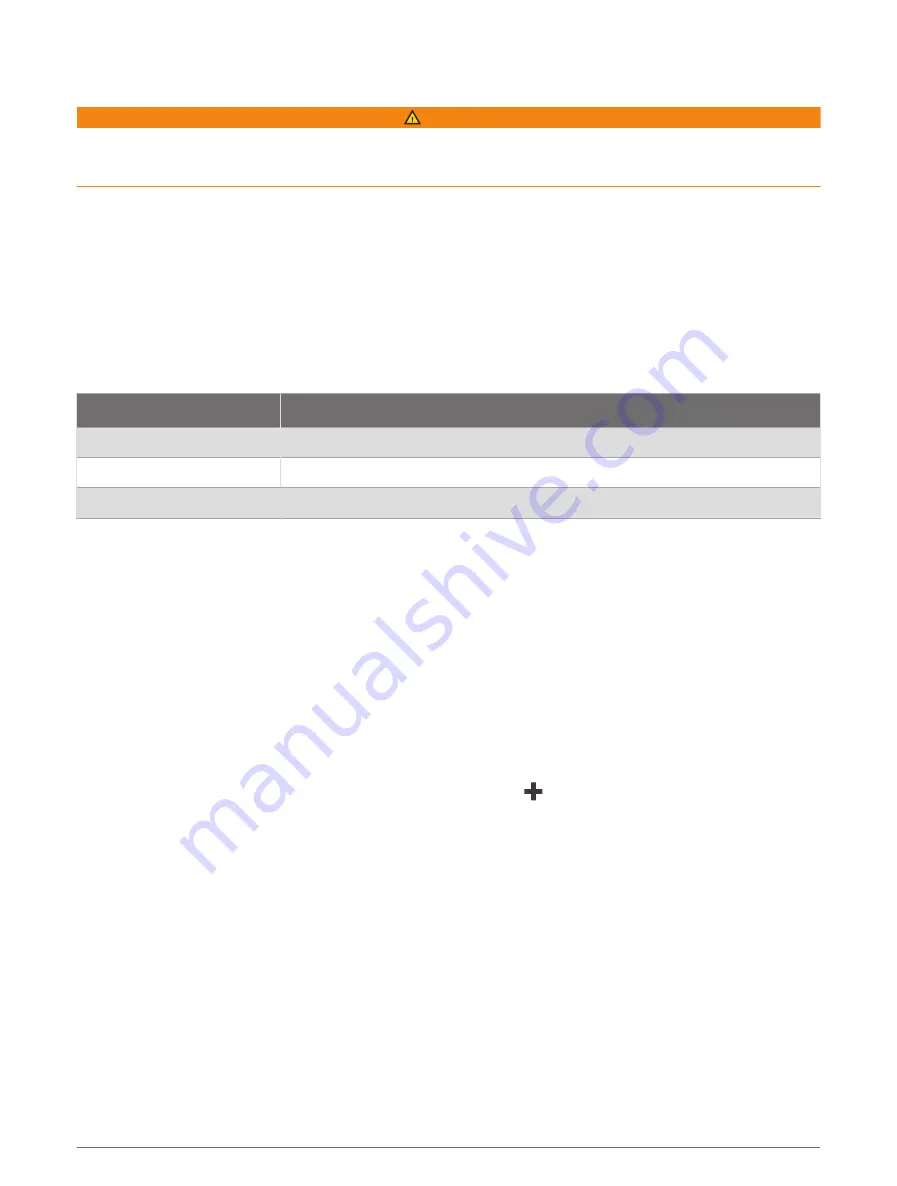
An indicator for a tide station appears on the chart as a vertical bar graph with an arrow. A red arrow pointing
downward indicates a falling tide, and a blue arrow pointing upward indicates a rising tide. When you move the
cursor over the tide station indicator, the height of the tide at the station appears above the station indicator.
Current direction indicators appear as arrows on the chart. The direction of each arrow indicates the direction
of the current at a specific location on the chart. The color of the current arrow indicates the range of speed for
the current at that location. When you move the cursor over the current direction indicator, the specific current
speed at the location appears above the direction indicator.
Color
Current Speed Range
Yellow
0 to 1 knot
Orange
1 to 2 knots
Red
2 or more knots
Showing Tides and Current Indicators
NOTE: This feature is available with premium charts, in some areas.
You can show static or animated tide and current station indicators on the Navigation chart or Fishing chart.
1 From the Navigation or Fishing chart, select Menu > Layers > Chart > Tides & Currents.
2 To show animated tide station indicators and animated current direction indicators on the chart, select
Animated.
Showing Satellite Imagery on the Navigation Chart
NOTE: This feature is available with premium charts, in some areas.
You can overlay high-resolution satellite images on the land or on both land and sea portions of the Navigation
chart.
NOTE: When enabled, high-resolution satellite images are present only at lower zoom levels. If you cannot see
high-resolution images in your optional chart region, you can select to zoom in. You also can set the detail
level higher by changing the map zoom detail.
1 From the Navigation chart, select Menu > Layers > Chart > Satellite Photos.
2 Select an option:
• Select Land Only to show standard chart information on the water, with photos overlaying the land.
NOTE: This setting must be enabled to view Standard Mapping
®
charts.
• Select Photo Map Blend to show photos on both the water and the land at a specified opacity. Use the
slider bar to adjust the photo opacity. The higher you set the percentage, the more the satellite photos
cover both land and water.
16
Charts and 3D Chart Views


