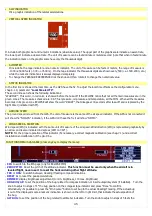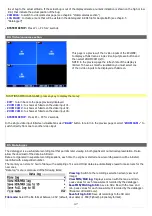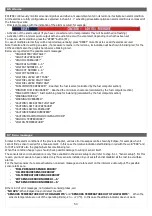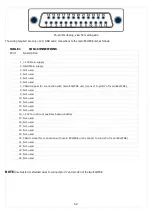
8. Using the ECLIPSE IFIS, PFD or EIS
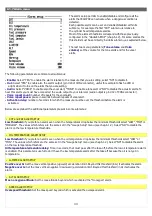
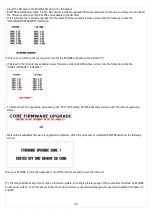
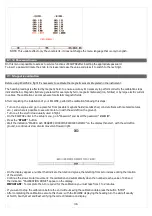
ECLIPSE IFIS is organized in 3 monitoring pages: EIS (engine data), PFD (flight data) and IFIS ( flight data).
•
If you have ECLIPSE EIS model, refer only to “EIS SECTION”
•
If you have ECLIPSE PFD model, refer only to “PFD SECTION”
8.1 EIS section
In this page all the important engine and fuel data is clearly displayed in both graphical and numerical indications. All the green,
yellow and red zones is completely customizable as explained in “GAUGE SETUP MENU”; when a measurement enter in its red
range the corresponding numerical indication become blinking.
The available indications are:
•
Tachometer with both graphical and numerical indication. The numeric indicator is normally white but become yellow or red
when enter in this ranges.
•
MAP with both graphical and numerical indication, in inches of mercury
•
Oil pressure with both graphical and numerical indication in BAR.
•
Oil temperature with both graphical and numerical indication in °C.
•
EGT and CHT with graphical indications (complete cylinders indications is available only if installed optional EGT and CHT
probes). Below each graphic bars there is the corresponding cylinder number.
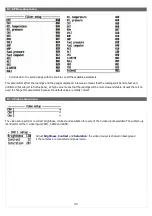
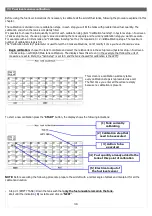
For both CHT and EGT is also available the following indications (see picture):
40
Tachometer
MAP
Hourmeters
Oil
Pressure
Oil temp.
EGT
Section
CHT Section
Engine peaks
memory
Fuel levels
section
Flight
Timer
Fuel Computer
section
READINGS Section:
Voltage, current, OAT, CAT,
Fuel pressure
Status indicator
Содержание Eclipse
Страница 6: ...ECLIPSE PART I INSTALLATION 6 ...
Страница 7: ...2 Dimensions 7 ...
Страница 22: ...ECLIPSE PART II OPERATING MANUAL 22 ...


