


SmartVue Operator’s Manual
30
10-0004-R13
Allow Threshold Configuration from Meter – The setting, Yes or No, sets
whether the given indicator’s threshold value can be changed from the
Meter
screen by pressing the indicator image. This can provide a quick way to change
the threshold or clear a latched condition without having to navigate through the
menus. Setting this option to
No can prevent unwanted or unintended changes for
critical applications.
3.
Press
Exit. This will return you to the Meters menu.
4.
Press
OK.
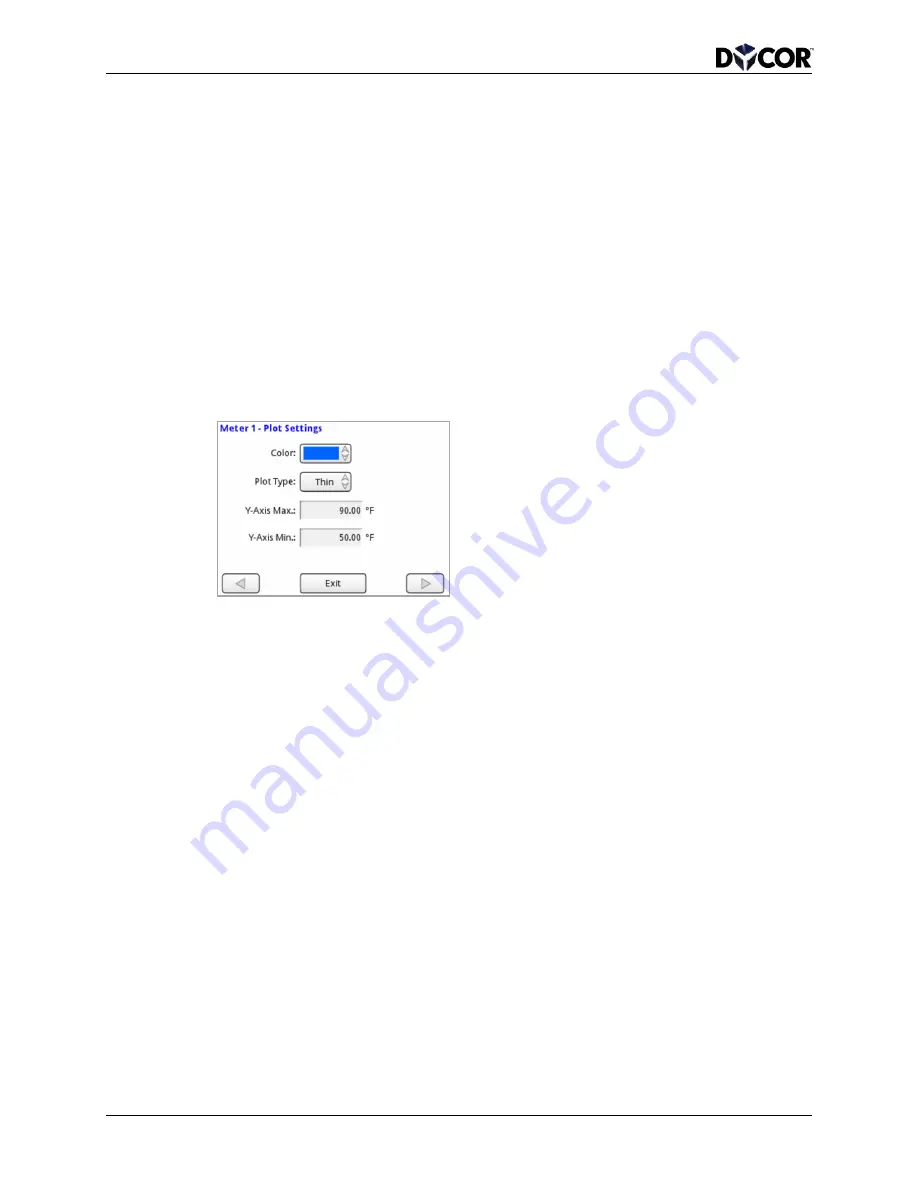
To configure the plot settings for a History Graph meter
1.
Enter the meter’s configuration screen and press an arrow button to navigate to
the
Plot Settings screen.
Color – The line data color (there are nine to choose from)
Plot Type – Choose from: Thin, Thick, or Fill
Y-Axis Max, Y-Axis-Min. – Specifies the maximum and minimum values for the
vertical y-axis. You should choose values that will allow your data to be plotted
within the graphing area.
2.
Press
Exit. This will return you to the Meters menu.
3.
Press
OK.


