


SmartVue Operator’s Manual
10-0004-R13
27
6.0
Assigning and Configuring a Meter
The meter screen displays data for up to four meters simultaneously with a variety of
layout options. Note that while you may usually want to display data for an input on the
Meter screen, it is not required, and the process will still run.
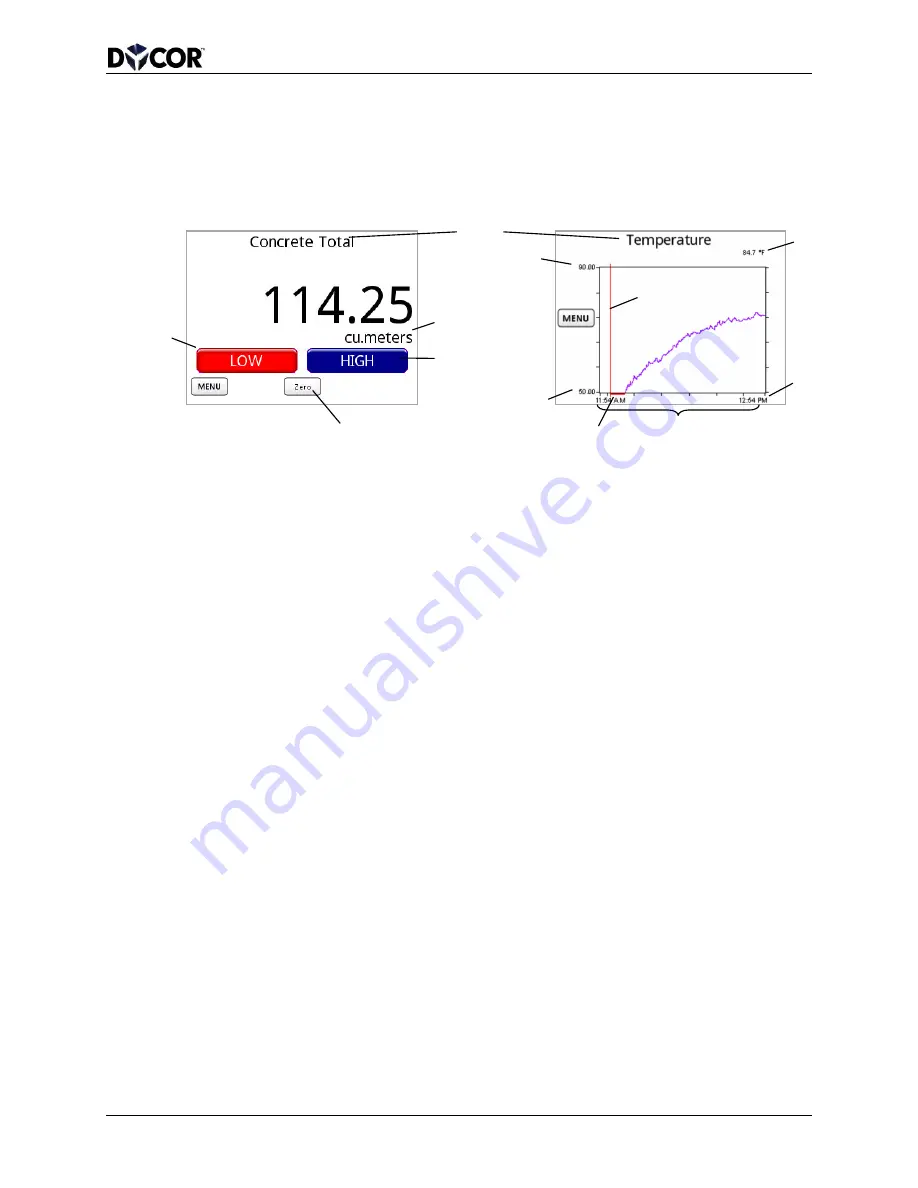
Figure 6-1 Meter screen elements
Any meter can be configured to display sampled data in one of two forms: a digital meter
or a history graph. A digital meter displays data numerically while a history graph
displays an historical line graph allowing a trend to be observed over a specified period.
Digital meters can also be configured to control indicators for specified limit values.
When a limit value is reached you can have it turn on a
High or Low indicator on the
meter and even latch at that state. These indicators can also act as buttons to configure
threshold values. The limit values can also be used to control the state of a digital output.
If you want to control a digital output based on the value of a certain input, you can set
the same or different values using the
Set Outputs configuration for a digital output.
Refer to Section 7.0
Setting Up an Output.
The history graph will display a red vertical line if there is an error reading an incoming
data value. This can occur just after the unit has been powered up and the signal
conditioning firmware is also just starting up. If the data is outside of the plot range for
the chosen y-axis scale, then a red line along the horizontal axis will be displayed. If this
situation is persistent then you will need to alter your y-axis settings. These lines will
appear gray if the chosen data line color is red.
Note
•
When exiting from the main menu to return to a
Meter screen that displays a
history graph you may notice a delay of several seconds while the stored data for
the graph is loaded from memory.
Y-Axis Max.
Y-Axis Min.
Right
indicator
Zero button
(Total/Rate process, Total data point)
Current
value and
units
Left
indicator
Label
Units
Current
time
History length
Data read error
Data out of y–
axis scale range


