24.
25.
Traffic On Route
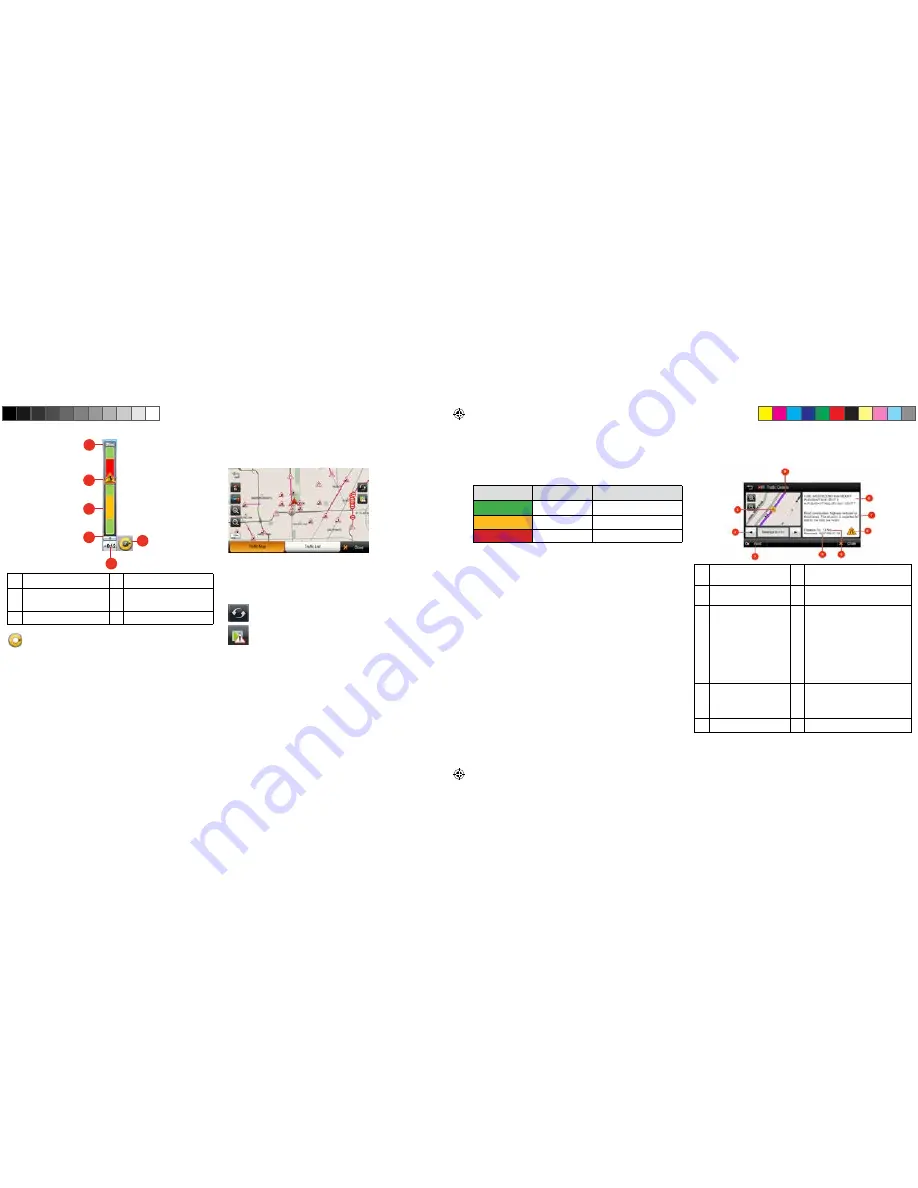
If a traffic event (an incident such as a roadblock) occurs on your route,
the Traffic Status Icon on the main map will change to yellow and the Traffic bar
will appear. This number in the center of the icon represents the number of
traffic events on your route. In addition to this, a chime will sound for every new
event received that affects your route.
In the example above, two (2) events shave been reported for the route.
If there is a delay associated with this event(s), a box will appear to the left of
the Traffic Status Icon indicating the estimated delay.
To get more details on these traffic events, or get the option to avoid these events,
simply tap the Traffic Status Icon to see the Traffic Details screen for each event.
The Traffic bar will appear for 30 seconds when an incident occurs or is updated on your
route. To expand or collapse the Traffic Bar, simple tap the arrow next to the time delay.
Traffic Map
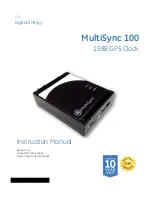
The traffic map presents a map with traffic flow and traffic event(s). The traffic event
icons indicate the type of traffic event.
On the small scale traffic map (zoomed out), traffic flow may be seen. Traffic event icons
are turned off at this scale to see the traffic map clearly.
On the large scale maps (zoomed in), the Traffic event icons appear together with the
traffic flow. You may tap any traffic event icon to receive more details on the event.
Tap the refresh button to update the traffic information.
Tap the toggle button to switch between live and predictive traffic display.
4
3
2
1
6
5
1
Expand / Collapse the Traffic bar
4
Distance from current position.
2
Traffic Congestion Extent
5
Traffic Status Icon (Tap to go to
Traffic Details)
3
Traffic Incident
6
Estimated Delay
2
Traffic Flow
The Traffic map contains traffic flow information. The line colours: yellow, red and
black represent the speed at which traffic is moving.
The purple line represents an incident’s extent (i.e. the where it begins and ends) and
means that traffic is flowing normally.
Congestion events will appear in the Traffic List.
A triangle with these colors is placed to the left of the traffic symbol in the list. Refer to
the Traffic List section for more details.
Traffic Details
At times, you may need to get more information on a specific traffic event. When in the
Traffic map or Traffic List screen, simply tap any event for more details.
1
Traffic Event Icon. The icon is
placed at the start of the incident.
6
Traffic Event Icon. In this example, the
icon means ‘Lane Reduction’.
2
Next and Previous. You can scroll
through the list of traffic events.
7
Detailed description of the traffic event.
3
Avoid / Cancel. Tap [AVOID] to
reroute around the traffic event.
You may only avoid ‘On Route’
traffic events. The [CANCEL]
button will only appear for events
that you have asked to avoid.
Tap [CANCEL] to remove the
avoidance condition for this event.
This means that navigation will
no longer try to avoid this event.
8
Road, Direction, Start and End Junctions
of the event.
4
Time the traffic message was
received or updated.
9
The magenta line indicates the ‘extent’ of
the traffic event. The arrow head is placed
at the end of the incident and indicates
the traffic travel direction.
5
Distance to the traffic event
Color
Meaning
Speed Range
Fast
Normal
Slow
23-40 MPH (36-64 km/hr.)
Heavy
0-22 MPH (1-35 km/hr.)
6100PROHD_MANL.indd 15
12/30/13 10:23 AM


