


CoreWatch Users Guide
277
Chapter 16: Monitoring Real-Time Performance
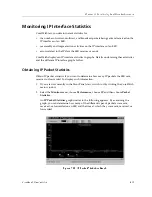
Using the Graph Toolbar
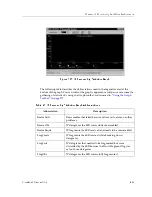
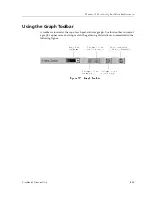
A toolbar is located at the top of each port-statistics graph. Use this toolbar to control
a graph’s appearance and stop or start the gathering of statistics as summarized in the
following figure:
Figure 183. Graph Toolbar
Magnifies
the y axis
Displays or hides
the vertical grid
Displays or hides
the horizontal grid
Displays or hides
a graphs legend
Stops or starts the
gathering of statistics
Содержание SSR-ATM29-02
Страница 1: ...CoreWatch User s Guide 9032564...
Страница 2: ......
Страница 6: ...Notice vi...
Страница 14: ...Contents 14 CoreWatch User s Guide...
Страница 18: ...Preface 18 CoreWatch User s Guide...
Страница 134: ...Chapter 9 Configuring Unicast Routing on the SSR 134 CoreWatch User s Guide...
Страница 194: ...Chapter 12 Configuring QoS on the SSR 194 CoreWatch User s Guide...
Страница 234: ...Chapter 13 Configuring Security on the SSR 234 CoreWatch User s Guide...
Страница 258: ...Chapter 15 Checking System Status 258 CoreWatch User s Guide...
Страница 278: ...Chapter 16 Monitoring Real Time Performance 278 CoreWatch User s Guide...
Страница 316: ...Chapter 18 Checking the Status of Routing Tables 316 CoreWatch User s Guide...
Страница 326: ...Chapter 20 Monitoring Faults 326 CoreWatch User s Guide...
Страница 330: ...Chapter 21 Obtaining Reports 330 CoreWatch User s Guide...
Страница 344: ...Appendix B CoreWatch Menus 344 CoreWatch User s Guide...