39
We reserve the right to make changes without any prior notice.
Translation from original instructions
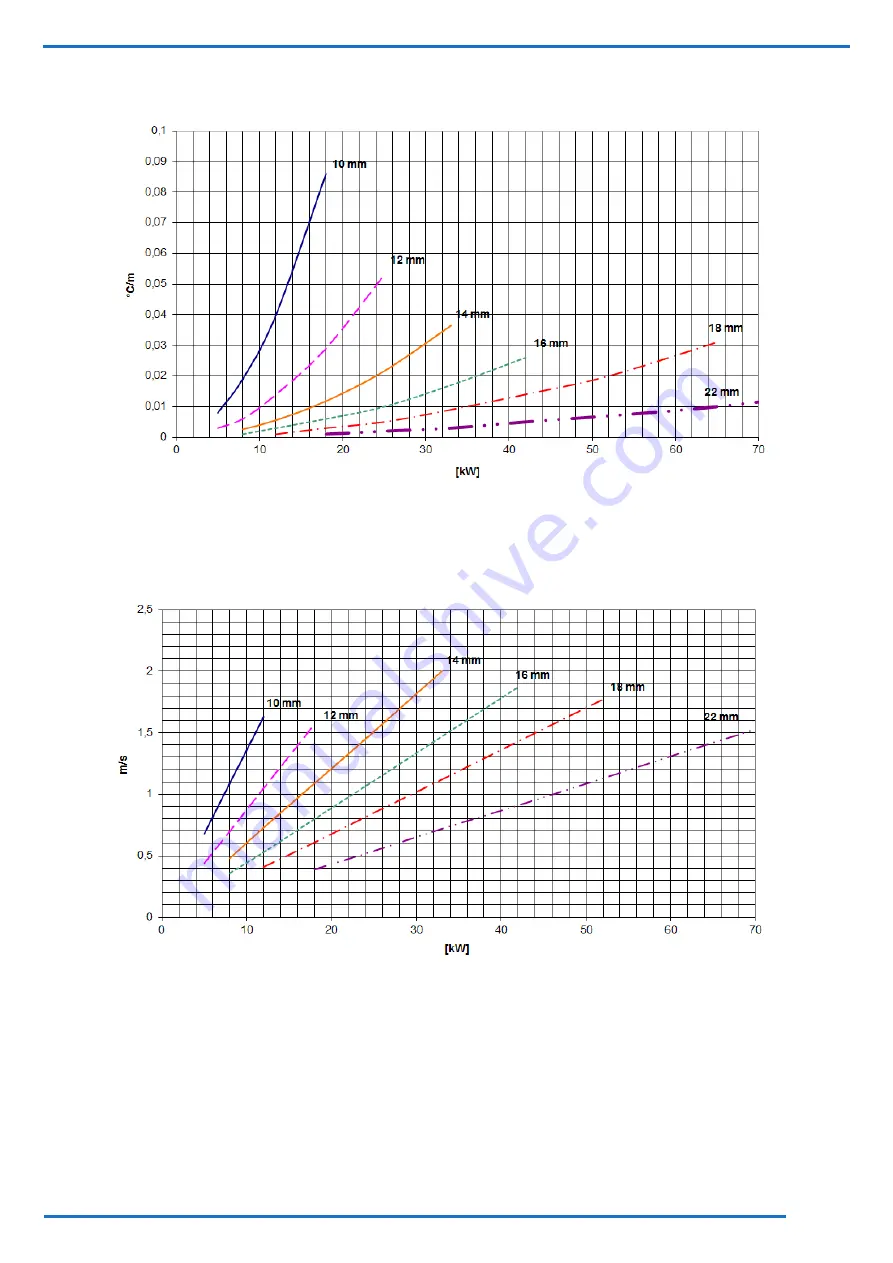
Fig. 13 Change of saturation temperature in the liquid lines
This diagram is useful in order to determine the approximate variation in saturation temperature, per equivalent linear metre
of pipe, on the basis of the cooling capacity and the diameter of the liquid line.
Fig. 14 Speed in the liquid lines
This diagram is useful in order to determine the approximate speed of the refrigerant, in metres per second, on the basis of
the cooling capacity and the diameter of the liquid line.
These diagrams, and those of the previous page, are valid for the following conditions:
-
saturation evaporation temperature equal to 8° C;
-
superheating equal to 5 ° C;
-
saturation condensing temperature equal to 50 ° C;
-
sub cooling equal to 5 ° C;


