20
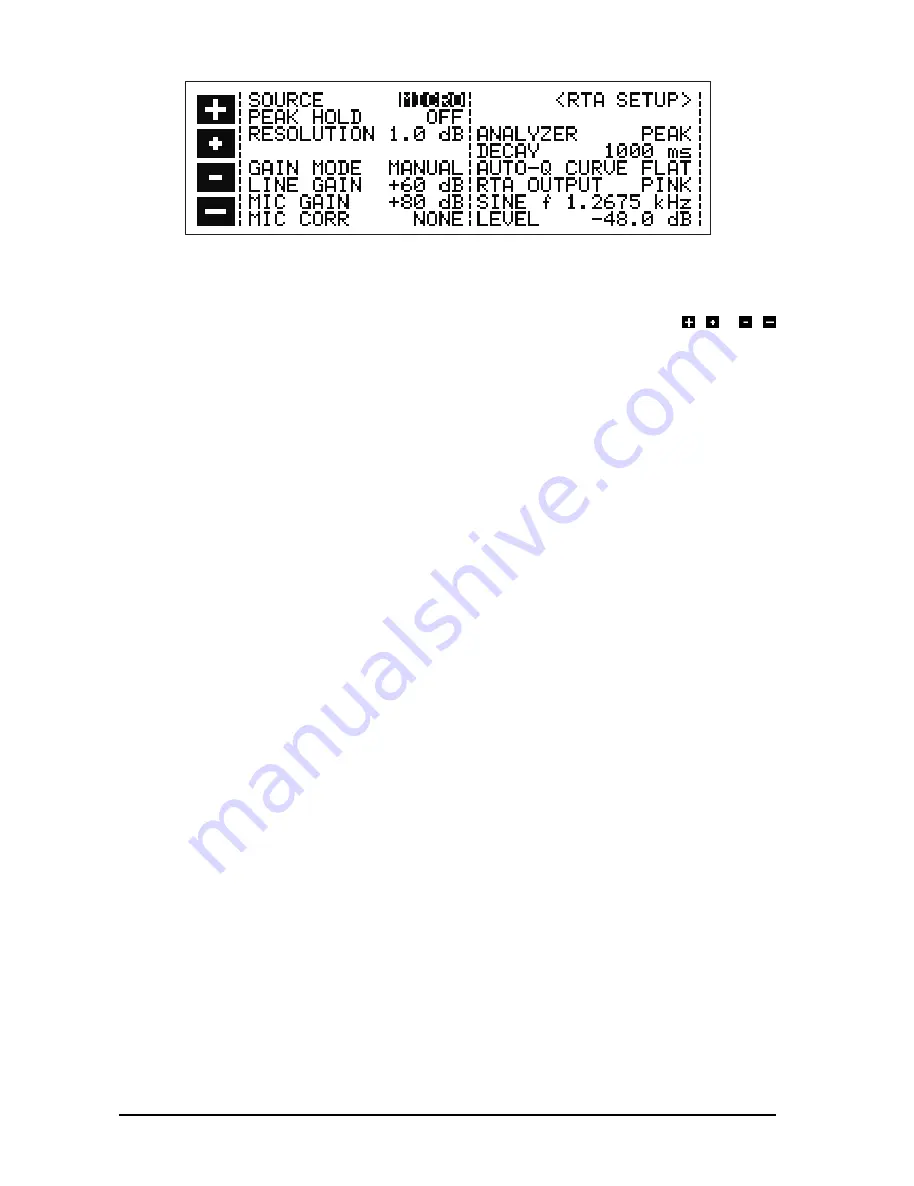
Fig. 2.9: RTA SETUP window
You can use the cursor key to choose the parameters or values you wish to edit. The currently selected field
is highlighted by inverting. You can change parameters or values with the softkeys marked / or /
respectively.
SOURCE
This field is used, as is the case in the RTA menu to select the Signal Source for the analyzer. The display here
reads as follows: MONO, RIGHT, LEFT, and MICRO, each referring to the sources available.
DETECTOR
Used to switch the measurement filter between Peak and RMS characteristics.
DECAY
Setting the DECAY: 15, 65, 250 or 1000 milliseconds per 20 dB.
MAX DISPLAY
ON = Peak Level Indicator ON, OFF = Peak Level Indicator OFF.
RESOLUTION
You can use this field to set the resolution of the Graphic Display, choosing between 0.5 dB per pixel, or 1 dB
per pixel. (A pixel is the smallest single point the display screen can generate). When measuring a steady
signal e.g. when using Pink Noise to adjust a loudspeaker system, the use of the finer resolution is recom-
mended.
AUTO-Q CURVE
You can use one of the 100 stored equalizer settings as a target curve for the AUTO-Q function. If no program
number has been given, FLAT will be displayed, meaning that an attempt will be made to achieve a linear
response.
GAIN MODE
The ULTRA-CURVE PRO analyzer is capable of setting itself dynamically to suit the input signal level. This
frees you from adjusting the input level manually. In this AUTO mode, the gain levels selected by the
ULTRA-CURVE PRO will be shown in the respective LINE GAIN and MIC GAIN fields. The automatic adjust-
ment can be switched off (MANUAL).
LINE GAIN
When operating in manual mode, the input amplification for the internal signal is displayed in this field. It can
be adjusted, in 4 dB steps, from 0 to 60 dB. (This feature is solely used in RTA mode).
MIC GAIN
As above, for the Reference Microphone Input. Gain can be adjusted from 20 to 80 dB.
MIC CORR
You can use one of the stored EQ curves as a corrective curve for the analyzer measurement, to compensate
for any frequency response variations caused by the Reference Microphone. In the field the chosen program
position, and the chosen side (L/R) are displayed. NONE = no corrective curve.
There are three fields in which you can choose which type of output signal from the ULTRA-CURVE PRO
digital generator you wish to use to make a measurement:
2. OPERATION
All manuals and user guides at all-guides.com
Содержание ULTRA-CURVE PRO DSP8024
Страница 49: ...49 E Fig 6 7 RTA window 6 APPENDIX All manuals and user guides at all guides com...
Страница 54: ...All manuals and user guides at all guides com...
Страница 55: ...All manuals and user guides at all guides com...
Страница 56: ...All manuals and user guides at all guides com a l l g u i d e s c o m...


