


shows the metering parameter choices .
Flow
Energy NET
DOP Quality
TT Aperture Start
Totalizer NET
Energy POS
TT Flow Velocity
RTD1 Temperature
Totalizer POS
Energy DOP
TT Delta T
RTD2 Temperature
Totalizer NEG
Energy NEG
TT Delta T Raw
RTD Delta Temp
Totalizer DOP
TT Flow
TT TOF Bias Raw
IO Voltage In
Flow Velocity
TT Gain
TT TOF Fluid
IO Digital In
Hybrid Mode
TT Quality
TT Fluid SOS
IO Voltage Out
Reynolds Number
DOP Flow
DOP Flow Velocity
IO Current Out
Power
DOP Gain
DOP Frequency
IO Digital Out
TT = Transit Time DOP = Doppler
Table 5: Meters drop-down menu choices
Graph Page
Axis Select
Sequentially
Main, X,
Y-Left, Y-Right
Shift Center
of Axes
More Negative
Zoom Axes
(Zoom In)
Restore All
Zoom & Shift
to Default
Shift Center
of Axes
More Positive
Zoom Axes
(Zoom Out)
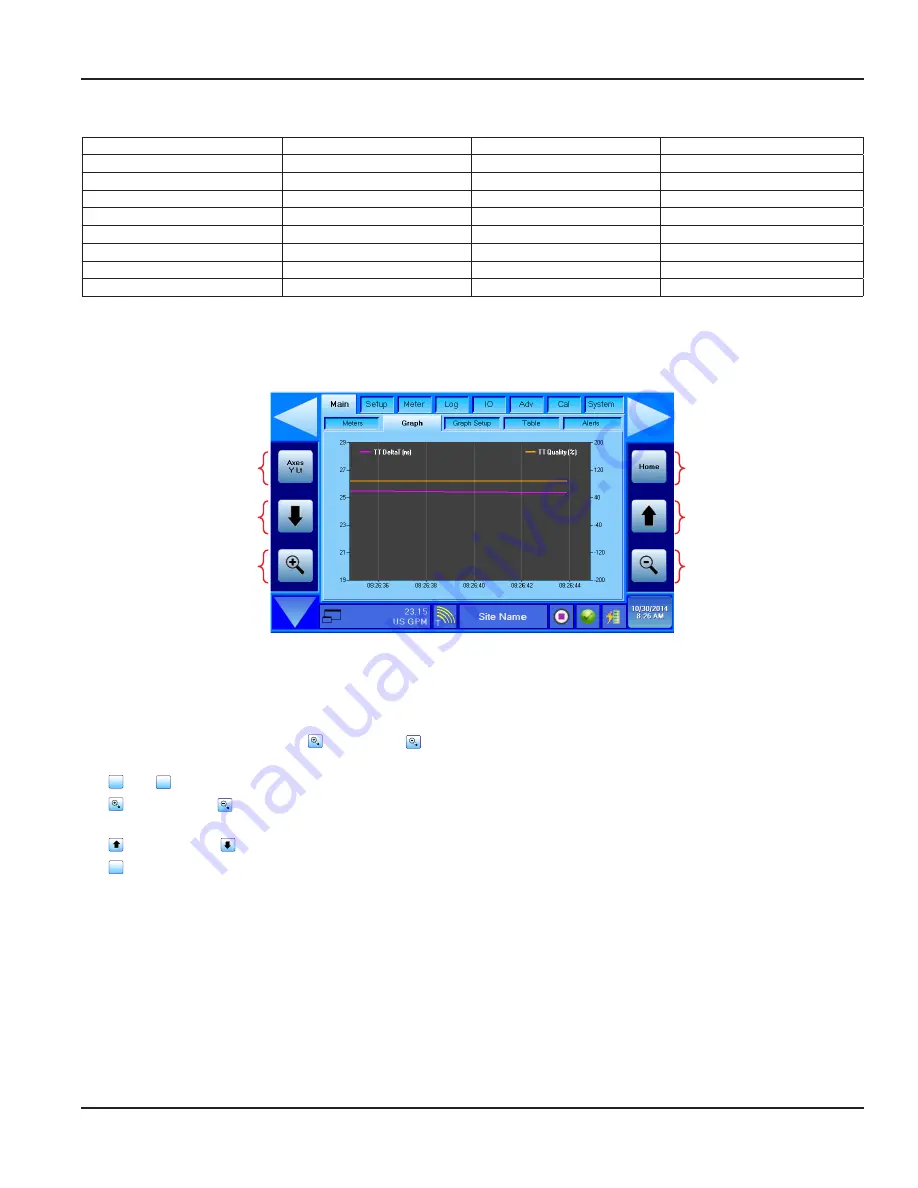
Figure 40: Main > Graph
Txes Scaling Buttons
Control of the axis scaling is performed with the axes scaling buttons . Pressing the Axes button successively moves through
the three axis configuration choices as shown in
.
The X axis is always time-based . The (
Zoom In
) or (
Zoom Out
) buttons expand or contract the timeline shown on the
horizontal (X axis) . The minimum graph time period is 10 seconds and the maximum is 1 year .
The
Axes
Y Lt
and
Axes
Y Rt
functions control the scale of the left and right sides of the graph, respectively .
The (
Zoom In
) and (
Zoom Out
) buttons work in the same fashion as on the X axis except that on the
Y Lt
and
Y Rt
axis
they expand or contract the range of the vertical scaling .
The (
Scroll Up
) and (
Scroll Down
) buttons shift the zero point of the graph up or down .
The
Home
(
Home
) button resets the graph to the parameters set using the
Main
>
Graph Setup
screen .
Main Group
Page 33
November 2016
HYB-UM-00090-EN-04


