


Advanced Instruments Inc.
Calibration & Accuracy Overview
Single Point Calibration: As previously
described the galvanic oxygen sensor
generates an electrical current proportional
to the oxygen concentration in the sample
gas. In the absence of oxygen the sensor
exhibits an absolute zero, e.g. the sensor
does not generate a current output in the
absence of oxygen. Given the linearity and
absolute zero properties, single point
calibration is possible.
Pressure: Because sensors are sensitive to
the partial pressure of oxygen in the sample
gas, their output is a function of the number
of molecules of oxygen 'per unit volume'. For
best accuracy, the pressure of the sample
gas and that of the calibration gas must be
the same (in reality within 2-5 psi) so that
when the SAMPLE/SPAN gases are switched, the gas flow rate would not drastically change.
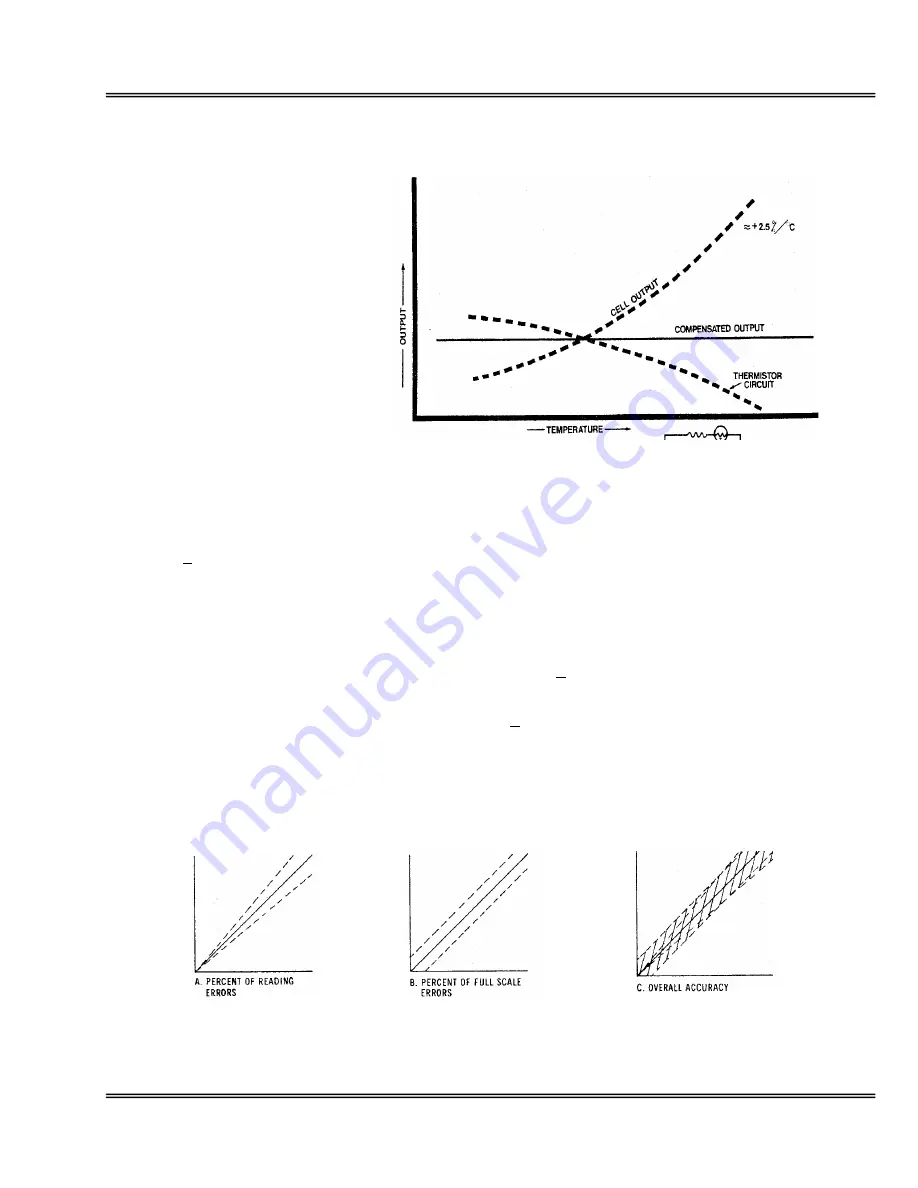
Temperature: The rate at which oxygen molecules diffuse into the sensor is controlled by a Teflon membrane
otherwise known as an 'oxygen diffusion limiting barrier. The fact that all diffusion processes are temperature
sensitive, the sensor's electrical output also varies with temperature. This variation is relatively constant (2.5% per
ºC change in temperature). A temperature compensation circuit employing a thermistor offsets this effect with an
accuracy of +5% or better (over the operating temperature range of the analyzer) and generates an output signal
that is virtually independent of small ambient temperature variation. Note: To minimize error in oxygen
measurement, the calibration of the analyzer should be carried out as close as possible to the temperature during
sampling. A small temperature variation of ~10º F will produce < 2% error.
Accuracy:
In light of the above parameters, the overall accuracy of an analyzer is affected by two factors:
1) 'Percent of reading errors', illustrated by Graph A below, such as +5% inherited error in the temperature
compensation
circuit due to the tolerances of the resistors and thermistor.
2) 'Percent of full scale errors', illustrated by Graph B, such as +1-2% linearity errors generally associated with
tolerances in the electronic components, which are really minimal due to today's technology and the fact that other
errors are 'spanned out' during calibration.
Graph C illustrates these 'worse case' specifications that are typically used to develop an analyzer's overall accuracy
statement of < 1% of full scale at constant temperature or < 5% over the operating temperature range. QC testing
is typically < 1% prior to shipment.
Example 1: As illustrated by Graph A any error during a span adjustment, e.g., at 20.9% (air) of full scale range
would be multiplied by a factor of 4.78 (100/20.9) when used for measurements of 95-100% oxygen concentrations.
11


