background image

USER MANUAL | ICOS | INSTRUCTIONS | UM/ICOS-EN REV. B.2

61

Replace the Fuse

If the fuse blows or is otherwise damaged, the analyzer automatically turns off.

To replace the fuse:

1.

Flip the Power switch to OFF on the left side of the analyzer.  (Figure 4)

2.

Unplug the 11-30 VDC power connector from the left side of the analyzer.  (Figure 4)

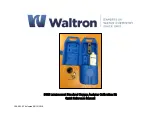
3. Unlatch the Case Securing Latches.  (Figure 45)

a. Push the latch button.
b. Pull down on the latch.

Figure 45: Case Securing Latches

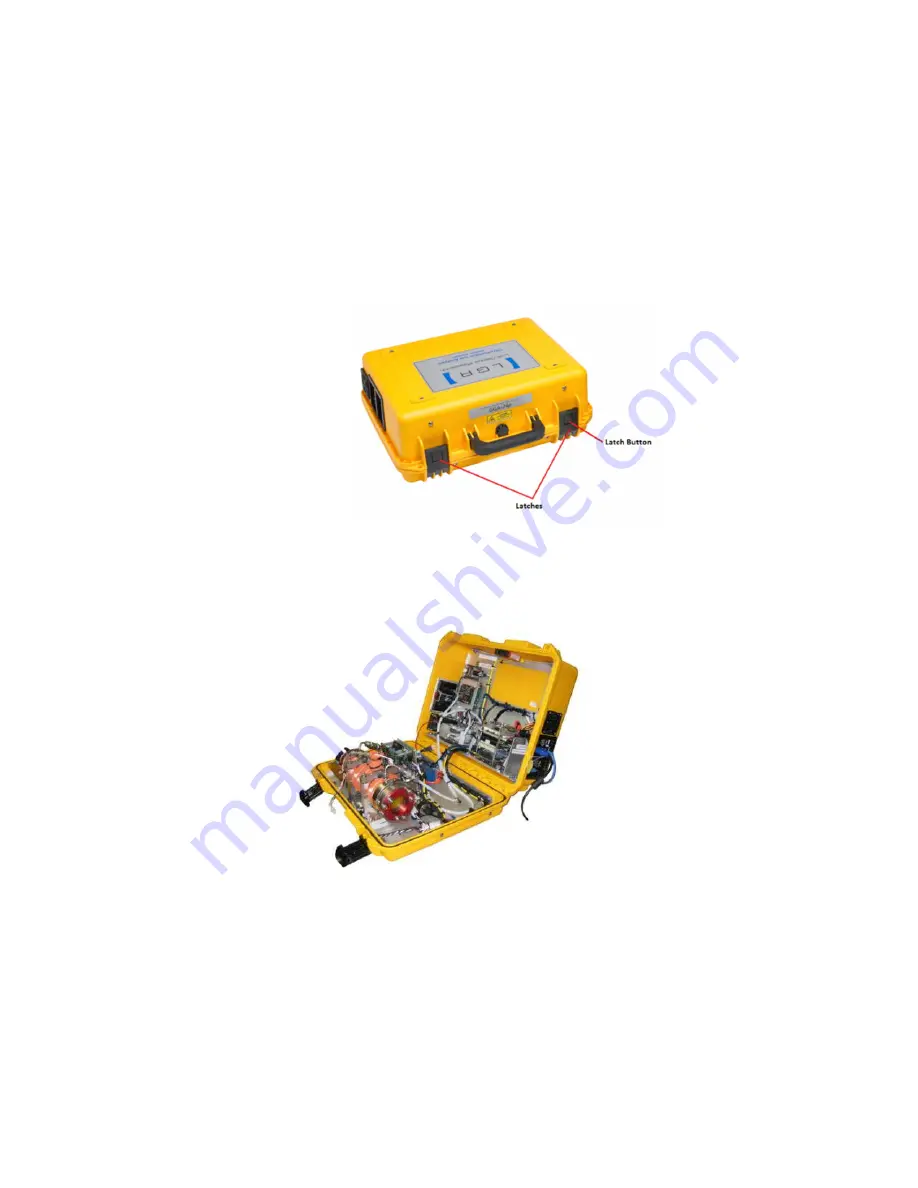
4. Open the case top.  (Figure 46)

Figure 46: Open the Case Top

Содержание GLA132 Series

Страница 1: ... ABB MEASUREMENT ANALYTICS USER MANUAL User Manual ICOS GLA132 Series Ultraportable Analyzers ...

Страница 2: ...view 13 Performance Specifications 13 Ambient Humidity 13 Operating Temperature 13 Maximum Altitude 13 Power Requirements 13 Fuse Ratings 13 Cable Plugs and Voltage for EC Countries 13 External Dimensions 14 Weight 14 Cell Volume 14 Standard Components 15 Optional Components 15 Power Connections 17 Emergency Shutdown Procedure 17 Data Interface Connection Ports 18 Plumbing Diagram 19 Inlet Outlet ...

Страница 3: ...ser Adjust Tab 52 MIU Tab 54 Analog Output Tab 55 Water Vapor Isotope Standard Source Tab WVISS Tab Optional 57 Service Tab 58 Shutting Down the Analyzer 59 4 Maintenance 60 Daily Operation Checklist 60 Mirror Ring Down Time and Maintenance 60 Replace the Fuse 61 Appendix A About Gas Analyzers and Laser Absorption Spectroscopy 64 Conventional Laser Absorption Spectroscopy 64 ABB LGR s Off Axis Int...

Страница 4: ...5 GLA132 H2SN Hydrogen Sulfide Analyzer 116 GLA132 HCl Hydrogen Chloride Analyzer 117 GLA132 HF Hydrogen Fluoride Analyzer 118 GLA132 HFHC Hydrogen Fluoride and Hydrogen Chloride Analyzer 119 GLA132 MCEA1 Carbon Monoxide Carbon Dioxide Methane Analyzer 120 GLA132 OXCC Industrial Emissions Analyzer 121 GLA132 SAM Hydrogen Sulfide and Ammonia Analyzer 122 GLA132 SOFX1 Soil Gas Analyzer 124 GLA132 SO...

Страница 5: ... corrections Cybersecurity This product is designed to be connected to and to communicate information and data via a network interface It is your sole responsibility to provide and continuously ensure a secure connection between the product and your network or any other network as the case may be You shall establish and maintain any appropriate measures such as but not limited to the installation ...

Страница 6: ...fications Symbols Standards Tested and Met 2004 108 EU EMC EN61326 1 Title 21 Code of Federal Regulations chapter 1 sub chapter J WEEE Directive The analyzer is not subject to WEEE Directive 2002 96 EC Waste Electrical and Electronic Equipment or relevant national laws e g ElektroG in Germany The product must be disposed of at a specialized recycling facility Do not use municipal garbage collectio...

Страница 7: ...r runs safely without risk to the operator Modifying the analyzer to operate with the case cover open can injure personnel Bypassing the analyzer interlock switch to open the case cover during analyzer operations can cause serious bodily injury Even though the analyzer provides a second layer of protection such as a laser cover to prevent the user from the invisible laser beam or any secondary ref...

Страница 8: ...aintenance instructions and maintenance kits Make sure the analyzer is unplugged before working with the internal components Failure to do so may result in damage to the analyzer and electric shock Safety Provisions for a Chemical Spill Follow these precautions when dealing with all chemicals Keep all chemical containers away from heat sparks and open flames Use only on grounded equipment and with...

Страница 9: ...you type in fields and also button choices that you enter Warning Icons Table 2 shows and describes the warning icons used in this manual Table 2 Warning Icon Descriptions Icon Meaning NOTE or IMPORTANT Emphasizes facts and conditions important to analyzer operation WARNING General Warning Icon gives general safety information that must be followed to avoid hazardous conditions WARNING Electrical ...

Страница 10: ...emperatures between 20o C and 60o C Save the original shipping materials to use when returning the analyzer to ABB LGR if factory service or repair is needed Table 3 lists and describes the safety icons on ABB LGR shipping boxes Follow these instructions when transporting and storing boxed analyzers Table 3 Transportation and Storage Icon Descriptions Icon Meaning Store your analyzer in a sheltere...

Страница 11: ...ng transportation to ABB LGR is at customer s expense 5 No charge repair parts may be sent at ABB LGR s sole discretion to the purchaser for installation by purchaser 6 ABB LGR s liability is limited to repair or replace any part of the analyzer free of charge if ABB LGR s examination discloses the part to be defective The laws of some locations may not allow the exclusion or limitation on implied...

Страница 12: ...sued RMA number must be prominently displayed on the return package No returns will be accepted collect or C O D On all warranty returns ABB LGR will pay the shipping charges on the return of the merchandise to the customer Customer Support ABB provides product support services worldwide To receive product support either in or out of warranty contact the ABB office that serves your geographical ar...

Страница 13: ...pecifications Ambient Humidity 99 relative humidity non condensing Operating Temperature 5 45o C Maximum Altitude 6 000 Feet Power Requirements 60 Watts typical 11 30 VDC battery power 66 Watts typical 15 230 VAC 50 60hz AC adaptor 120 Watts maximum Fuse Ratings 32 VAC 10 Amps Fast blow fuse Cable Plugs and Voltage for EC Countries See page 129 Always use the power supply cord provided by ABB LGR ...

Страница 14: ...USER MANUAL ICOS INSTRUCTIONS UM ICOS EN REV B 2 14 External Dimensions 18 5 W x 14 D x 7 H Weight 16 9 kg Cell Volume 345 cc cavity 10 cc tubing Total volume 355 cc ...

Страница 15: ... 8 MIU 16 o Power cable o 25 pin control signal cable o 64GB solid state hard drive Water Vapor Isotope Standard Source Standard range WVISS o WVISS hand pad o Control signal cable o BNC cable This analyzer has been CE certified using data cables three meters long or less Connecting the analyzer using longer data cables is not recommended The wireless user interface will not work if The analyzer h...

Страница 16: ...USER MANUAL ICOS INSTRUCTIONS UM ICOS EN REV B 2 16 Figure 2 shows the left side of the analyzer Figure 2 Left Panel Figure 3 shows the right side of the analyzer Figure 3 Right Panel ...

Страница 17: ...onnector and the power switch Figure 4 Power Connections and AC Voltage Selection Switch The analyzer is equipped with a three prong power plug The third prong of the facility electrical outlets must be grounded Failure to ground the third prong may result in electrical damage to the analyzer and electrical shock to the operator Emergency Shutdown Procedure If the analyzer malfunctions and require...

Страница 18: ... to a local area network LAN and allows access to the data directory using an external computer Serial port 9 pin D sub For real time digital measurement output Video port 15 pin D sub Connects an external monitor to the analyzer Analog out ports Provides a DC voltage proportional to the measured gas concentration If this output is connected to an external device it must be terminated into a moder...

Страница 19: ...ding on the analyzer type Figure 6 Plumbing Diagram for a GLA132 GGA analyzer The internal pump draws gas through the SAMPLE INLET on the left side panel of the analyzer The gas is filtered through a screen filter before entering the pressure controller which regulates the pressure to maintain a specific set point The gas travels through the optical cell and out through the WASTE port Figure 7 sho...

Страница 20: ...e push connect INLET port An External In Line Filter Figure 10 is provided and can be attached to the INLET port During normal operation the pump draws the sample through the analyzer inlet and exhausts the sample through the waste port The push connect WASTE port may be Routed to the facility ventilation system or Remain open expelling non hazardous gas into the room air Figure 8 Inlet Outlet por...

Страница 21: ...ves a description of the warning labels Figure 9 shows the location of the labels on the analyzer Table 4 Warning Labels and Descriptions Label Description The laser is rated Class 3 invisible laser radiation when the housing is open Only trained maintenance personnel may open the analyzer housing General laser warning label Figure 9 Warning Label Locations ...

Страница 22: ... Interface Connections 1 See Figure 5 for a detailed description of the connections Connect the Inlet Outlet Plumbing Connections 1 If applicable connect a sample tube not provided from the push connect INLET port on the left panel of the analyzer to your sample source 2 The provided External In Line Filter can be used for additional filtering by connecting to the push connect INLET port on the ri...

Страница 23: ...pted Battery power to the analyzer is interrupted If any of these failures occur you will need a keyboard mouse and monitor to restart the analyzer A back up hard drive is recommended 2 Click on the launch button to manually launch the analyzer a The launch button is the abbreviated name of the gas analyzer For example the GLA132 GGA button displays GGA Figure 13 b If you don t make a selection wi...

Страница 24: ...itialization Figure 12 shows the screen you see while the integrity check runs The integrity check runs for one to two minutes before launching the analyzer s control software Do not turn off the computer while the integrity check is running Figure 12 File System Integrity Check Screen Thermal Stabilization The exact final cell temperature will be analyzer specific 25 C ...

Страница 25: ...launch countdown to manually start recording measurements by clicking the launch button o The launch button is the abbreviated name of the gas analyzer For example the GLA132 GGA launch button displays GGA as shown in Figure 13 Open the auto launch window by clicking Service Turn off the analyzer by clicking Shutdown Figure 13 shows the Launch Service screen Figure 13 Launch Service Screen ...

Страница 26: ...unch Service screen The Auto Launch screen displays the type of analyzer From this interface you can Change the auto launch delay timing Transfer files from the internal hard drive to an external storage device connected via USB by clicking Files Restore the analyzer s factory settings by clicking Restore Figure 14 shows the Auto Launch screen Figure 14 Auto Launch Screen ...

Страница 27: ...n on the User Interface Control Bar Figure 15 Figure 15 Control Bar Security Button 2 For initial login use the default Linux credentials for the username and password Figure 16 as follows User lgr Password 3456789 If you change and forget this password you will not be able to recover it without a factory restore There is only one Linux account Figure 16 Login Dialog Box 3 Click Login ...

Страница 28: ...yzer is displayed at the bottom of the main panel Green The analyzer is functioning properly Yellow The data may not be reliable or maintenance is required soon Red The analyzer requires maintenance to correct an identified fault Refer to the Alarm Status Display section on pages 32 34 for detailed Temperature Status and Analyzer Status descriptions This panel contains the User Interface Control B...

Страница 29: ...USER MANUAL ICOS INSTRUCTIONS UM ICOS EN REV B 2 29 User Interface Control Bar Use the control bar to operate the analyzer Figure 18 User Interface Control Bar ...

Страница 30: ...rate at which data is written to the log file Figure 24 Parameter Window Displays the Time Current time Data File Current filename to log data Gas Temperature Temperature in Cell Celsius C Gas Pressure Pressure in Cell Torr Laser A τ Laser A ring down time micro seconds µs Laser B τ Laser B ring down time micro seconds µs o Only applicable for two laser systems MIU Multiport Inlet Unit WVISS Water...

Страница 31: ...play The four displays within the display function are Numeric Alarm Status Spectrum TimeChart This section describes the displays Numeric Display The Numeric Display is the default display It appears when the analyzer is first turned on or re initialized Figure 19 shows an example of the Numeric Display screen for the GLA132 GGA It displays the numeric readout of the last measurements of gas at a...

Страница 32: ...l status of the analyzer The Alarm Status is color coded Green The analyzer is functioning properly Yellow The data may not reliable or maintenance is required soon Red The analyzer requires maintenance to correct an identified fault Figure 20 shows the Alarm Status Display with all parameters functioning properly Figure 20 Alarm Status ...

Страница 33: ...perating temperature range 11 CROSS OVER 14 Analyzer Temp Temperature High Low Warning The temperature is the high warning set point The temperature is the low warning set point 17 Fault NaN reading Occurs when there is a false or undefined value NaN not a number 19 Dead Band 20 Acceptable Range No warning alarm No warning alarm If the Alarm Status is Yellow or Red please refer to the Maintenance ...

Страница 34: ...d Occurs when laser signal power has degraded by 20 of the factory value 10 Maintenance Maintenance needed now Occurs when the analyzer requires maintenance every 381 days 11 CROSS OVER 12 Data Health A B Fit is not optimal The laser fitting condition is not optimal Occurs when residuals of fit go above normal operational values 13 Pressure Noisy Occurs when the specified operational pressure is n...

Страница 35: ...peak fit resulting from signal analysis as a blue line Figure 21 and Figure 22 show the Spectrum Displays for the GLA132 GGA The GLA132 GGA is a dual laser system The drop down selector in the lower right portion of the Spectrum Display lets you toggle between the two lasers Laser 1 also referred to as laser A displays CH4 and H2O peaks Figure 21 Laser 2 also referred to as laser B displays the CO...

Страница 36: ...pe Figure for Reference GLA132 AMA Figure 111 Figure 112 GLA132 CCIA2 Figure 113 GLA132 EAA Figure 114 GLA132 GGA Figure 115 and Figure 116 GLA132 H2SN Figure 117 GLA132 HCL Figure 118 GLA132 HF Figure 119 GLA132 HFHC Figure 120 and Figure 121 GLA132 MCEA1 Figure 122 and Figure 123 GLA132 OXCC Figure 124 and Figure 125 GLA132 SAM Figure 126 Figure 127 Figure 128 Figure 129 GLA132 SOFX1 Figure 130 ...

Страница 37: ...tion vs time Figure 23 shows the Time Chart with a continuous flow of gas A 10 point running average in black is shown going through the raw data shown in blue Click on the drop down box in the lower right corner of either window to toggle between available gases and to adjust the number of significant figures The data is saved to the file indicated in the left corner of the parameter window Figur...

Страница 38: ...e 18 is selected a pop up box appears to allow rate control adjustments to the operating mode and plot frequency Figure 24 Selections in this window may vary depending on analyzer configurations Figure 24 Rate Control Screen The Operating Mode radio buttons allow you to change the rate at which data is written to the log file To adjust the rate 1 Click the Rate button clock icon on the User Interf...

Страница 39: ... 24 2 Click the Plot on Demand radio button to manually plot the data a When selected the Refresh Plot button appears on the Main Panel display When Refresh Plot button is selected Figure 23 current data is added to the Main Panel display 3 Click the Plot every Nth fit radio button to automatically set the rate at which the data is updated on the Main Panel display a For example if you set the val...

Страница 40: ... text ASCII format and contain labeled columns displaying The time stamp of each recorded measurement Gas concentration Cell pressure Torr Cell temperature Celsius Ambient Temperature Celsius Ring Down Time microseconds The format can be changed in the Time Files menu of the Setup panel Figure 32 Figure 25 shows a typical data file for the GLA132 GGA Figure 25 The Beginning of a Typical Data File ...

Страница 41: ...re 26 Figure 26 File Transfer Menu Local Hard Drive left pane and USB Flash Drive right pane 4 Transfer data files from the analyzer hard drive to a USB storage device by dragging and dropping the files from the hard drive pane to the USB device pane Use the left mouse button to highlight one or multiple files in the window The directory windows default to the local hard drive on the left screen a...

Страница 42: ...ring files 5 Click the Unmount USB button Wait for the Safe to Remove USB Memory Device message before removing the USB memory device 6 Click Close to exit the File Transfer Menu Removing the USB memory device before seeing the Safe to Remove pop up message may result in loss of data ...

Страница 43: ... Figure 26 creates a daily folder containing new data files for each day that the analyzer operates To access the data files for a specific date double click the folder Each file from that day is displayed in chronological order Figure 27 Each file is a single zipped txt file using the following convention XXX_YYYY MM DD_f0000 txt zip Examples of files in the daily directory are shown in Figure 27...

Страница 44: ...rganized by date Figure 28 To access the archived files double click the Archive folder Figure 26 Each file is a single zipped txt file using the following convention YYYY MM DD zip Each zipped file contains the data files for the day that the analyzer operated Examples of files in the archive directory are shown in Figure 28 Figure 28 Archive Directory ...

Страница 45: ...EV B 2 45 File Transfer Error Screen The File Transfer Error screen Figure 29 displays when The USB Key does not have enough storage space The device is not recognized Try again with a correctly inserted USB device Figure 29 File Transfer Error ...

Страница 46: ...ns and services Configurations will vary among analyzer types To enter Setup mode 1 Click the Setup button on the User Interface Control Bar Figure 30 Figure 30 Setup button on the User Interface Control Bar 2 The default Time Files screen is displayed Figure 31 Figure 31 Setup Menu Tabs with Time Files Screen Selected ...

Страница 47: ...e the optional Multi Port Inlet Unit Configure the Analog Output Configure the optional Water Vapor Isotope Standard Source o Applicable only for GLA132 WVIA Service screen for technicians to check on the status of the analyzer Use these function tabs to make adjustments to the analyzer and its operation Time Files Tab The Time Files menu allows you to adjust the time zone manually set the clock a...

Страница 48: ...e data files The available timestamp formats are shown in Table 8 New file creation intervals when running continuously can be set by adjusting the value in the Output Interval minutes spinner control box Table 8 Available Time Stamp Formats Time Stamp Name Format Absolute Local American mm dd yyyy hh mm ss sss Absolute Local European dd mm yyyy hh mm ss sss Absolute GMT American mm dd yyyy hh mm ...

Страница 49: ...equal to the Logged File Rate i e 1 Hz divided by the Rate specified in the Time Files menu The output format is in the form of comma delimited ascii with the order of columns equivalent to the data file Use a null modem serial cable to connect the analyzer serial port to an external computer About The About section displays analyzer specific information such as the Build Date of the current softw...

Страница 50: ...ecessary follow the procedure detailed below Water vapor analyzers are calibrated differently and users must refer to the Appendix Calibration of WVIA and TWVIA analyzers on page 93 Calibration Procedure 1 Click the Setup button on the User Interface Control Bar Figure 18 2 Select the Calibration tab at the top of the screen to enter the Calibration menu Figure 33 Figure 33 Calibration Setup Scree...

Страница 51: ... to begin calibration 8 Each step is displayed in the lower right panel of the calibration screen as the analyzer performs the calibration Figure 34 shows the calibration process as a flow chart Figure 34 Calibration Flow 9 When the Calibration Complete message is displayed click the CLOSE button 10 Enter TimeChart by selecting the Display button on the User Interface Control Bar and verify that t...

Страница 52: ...er s wavelength has drifted beyond the target range of the analyzer The analyzer is operated outside the recommended temperature range Figure 35 shows the offset between absorption peaks and target lines For a 2 laser system both lasers need adjustment Figure 35 shows an example for the GLA132 GGA which has 2 lasers Laser A is the top plot and laser B is the bottom plot Figure 35 Absorption peaks ...

Страница 53: ...djust to the right b Down Arrow Peaks adjust to the left 5 If applicable adjust the Laser B Voltage bottom plot using the arrow buttons to shift the peaks until they are centered on their respective target lines a Up Arrow Peaks adjust to the right b Down Arrow Peaks adjust to the left 6 Deselect the Disable Laser Frequency Lock check box The software resumes automatic tracking and control of the ...

Страница 54: ...e ordered configuration These ports are directed to the inlet port of the analyzer for sampling unknown gases and reference gases The MIU menu can be configured to control which gases are introduced to the analyzer and for how long Figure 37 See the MIU Appendix on page 88 for detailed instructions on configuring and controlling the MIU Figure 37 Control Menu for the Optional Multi Port Inlet Unit...

Страница 55: ...r example Set 5 Volts 10 ppm on the expectation that the gases measured will be in the range near 2 ppm with occasional bursts up to almost 10 ppm Set 5 Volts 5 ppm to get exactly two times greater sensitivity on the analog output with the expectation that the concentration will not go above 5 ppm If the measured concentration goes above the maximum expected value for the Analog Output the on scre...

Страница 56: ...USER MANUAL ICOS INSTRUCTIONS UM ICOS EN REV B 2 56 Figure 39 shows the analog output connector Figure 39 Analog Output Connector ...

Страница 57: ...ope ratios for automated calibration of water vapor isotope analyzers GLA132 WVIA Use this panel to configure the control of the WVISS Figure 40 Select the WVISS tab at the top of the Setup Screen To Enable the WVISS click the WVISS Enabled selection from the drop down box For details on setup and functionality see the Configuring the Analyzer for the Optional WVISS Accessory Appendix on page 98 F...

Страница 58: ...ndent and are set based upon the last fixed setting Figure 41 Service Screen The Service tab contains 3 Service buttons Reset Tau Power button resets the mirror ringdown time and laser power to current settings This is typically done after mirrors have been cleaned Reset Counter button resets the of days that maintenance is required This is typically done after yearly maintenance Launch TeamViewer...

Страница 59: ...n Figure 43 Figure 42 User Interface Control Bar Exit Button 3 Click the OK button to halt data acquisition close the current data file and display the shutdown screen Figure 43 Figure 43 Analyzer Shutdown Prompt 4 When the You may turn off the instrument message displays Figure 44 you can safely shut off power to the analyzer by pushing the OFF switch on the left panel of the analyzer Figure 2 Fi...

Страница 60: ...tion in the flow system An increase in pressure could be indicative of a leak in the system or a pump failure Every 3 6 days Check the Laser Offset and adjust if necessary Figure 35 Mirror Ring Down Time and Maintenance Measurement cell mirrors are protected from contamination by an internal inlet filter With continued use the mirrors may gradually decline in reflectivity If a significant change o...

Страница 61: ...place the fuse 1 Flip the Power switch to OFF on the left side of the analyzer Figure 4 2 Unplug the 11 30 VDC power connector from the left side of the analyzer Figure 4 3 Unlatch the Case Securing Latches Figure 45 a Push the latch button b Pull down on the latch Figure 45 Case Securing Latches 4 Open the case top Figure 46 Figure 46 Open the Case Top ...

Страница 62: ...ICOS EN REV B 2 62 5 The fuse is located on the upper portion of the analyzer on the left side above the internal pump Figure 47 Figure 47 Analyzer Fused Inlet 6 Pull the fuse out of the fuse fixture Figure 48 Figure 48 Remove the Fuse ...

Страница 63: ...gure 49 Figure 49 Install the New Fuse in the Fuse Holder 8 Carefully close the case top and push the latches to lock the case 9 Re attach the 11 30 VDC power connector into the left side of the analyzer Figure 4 10 Flip the Power switch to the ON position on the left side of the analyzer Figure 4 ...

Страница 64: ...ere Iv is the transmitted intensity through the sample at frequency Io is the reference laser intensity prior to entering the cell S is the absorption line strength of the probed transition L is the optical path length of the laser beam through the sample 𝛘 is the mole fraction P is the gas pressure Φv is the line shape function of the transition at frequency 𝞾 In this case If the laser line width...

Страница 65: ...USER MANUAL ICOS INSTRUCTIONS UM ICOS EN REV B 2 65 ...

Страница 66: ...ngth Line strength of the probed transition Enables you to determine the mole fraction directly from the relation Use this equation to determine gas concentrations even in hostile environments without using calibration gases or reference standards These values are measured Mixtures containing several species Flows at elevated temperatures and pressures ...

Страница 67: ...ctive optical path length is 2500 meters Figure 51 Schematic Diagram of an Off Axis ICOS Analyzer Because the path length depends only on optical losses in the cavity and not on a unique beam trajectory like conventional multi pass cells or cavity ring down systems the optical alignment is very robust allowing for reliable operation in the field The effective optical path length is determined rout...

Страница 68: ...Protocol request when the analyzer is initialized If the analyzer does not receive a reply the analyzer Disables the Ethernet port Does not attempt another DHCP request until the analyzer is restarted When both conditions are met the data directory can be accessed using a Windows computer on the same LAN To access the data directory 1 Click Start Run and enter the IP address of the analyzer Exampl...

Страница 69: ...al Area Network LAN is not available plug the analyzer into a standalone broadband router example Netgear Model RP614 to enable the analyzer to obtain a Dynamic Host Configuration Protocol DHCP address from the router when the analyzer is started Then plug any Windows computer into the same broadband router to access the data directory A crossover Ethernet cable will NOT allow an external computer...

Страница 70: ... www tp link com support and enter the TP Link model number TL WR802N You must restart the analyzer whenever you change router modes for the mode change to take effect Local Connection You can also bypass the wireless router if you want to connect the analyzer to a local network Refer to the Connect Analyzer to Local Network section on page 74 for instructions on this configuration Wireless Contro...

Страница 71: ...ptop connect to the router using the SSID and password on the router Figure 52 Figure 52 Router SSID and Password Location 2 On the same device launch a Web browser then type http tplinkwifi net in the address bar Figure 53 Figure 53 Logging In 3 Enter admin in lowercase for both the username and password 4 Click Login ...

Страница 72: ... ICOS INSTRUCTIONS UM ICOS EN REV B 2 72 5 On the left panel click Quick Setup Figure 54 Figure 54 Start Router Configuration 6 Click Next 7 In the Main Panel select the Access Point button Figure 54 8 Click Next ...

Страница 73: ... or AP Wireless Password click Next To change the default Wireless Network Name and or AP Wireless Password change the names in the Wireless Network Name and or AP Wireless Password fields then click Next Figure 55 Wireless Setting Screen 10 In the Network Setting screen click Next Figure 56 Figure 56 Network Setting Screen 11 Click Finish 12 Restart the analyzer ...

Страница 74: ...ernet Union 2 Remove the Ethernet union next to the router Figure 57 3 Plug the black cable into either port of the Ethernet union Figure 58 Figure 58 Plug Cables into Ethernet Union 4 Plug the blue cable into the other port of the Ethernet union Figure 58 5 Connect a local area network LAN cable from an external computer to the analyzer Ethernet port located on the external side panel ...

Страница 75: ... software on the device you are connecting to the analyzer Set up VNC Software on Android Devices 1 On the Android device go to Settings WiFi Connect to Wireless Network 2 Connect to the wireless SSID network listed on the router sticker Enter the TP Link wireless router example TP LINK 775C as shown in Figure 52 For ultraportable analyzers the TP Link wireless router is installed inside the analy...

Страница 76: ... compete for dynamic addresses If the 192 168 100 100 address does not connect then use 192 168 100 101 8 Record the IP address of the Android device because it will be necessary to refer to it in Step 12 9 Install the VNC software by searching and installing from the Google Play store Search for Android vnc viewer and install the application by tapping on the Install button Figure 61 An Internet ...

Страница 77: ...8 100 100 or 192 168 100 101 that you recorded in Step 8 The IP address of the analyzer will be whichever address the Android device is not For example if the IP address of the Android device that was displayed in Step 8 is 192 168 100 101 then the IP address of the analyzer will be 192 168 100 100 13 In the Password field enter lgrvnc 14 Tap the Connect button to connect the Android device to the...

Страница 78: ...USER MANUAL ICOS INSTRUCTIONS UM ICOS EN REV B 2 78 Figure 64 Analyzer Software Interface Display with Size Adjustment for Android Devices ...

Страница 79: ...the analyzer and may be accessed by opening the case For all other analyzers the optional TP Link wireless router is attached to the outside of the case 3 Select your SSID network For example TP LINK D036 Figure 65 Figure 65 Network Connections Screen 4 The Enter Password screen appears Figure 66 In the Password field enter the wireless password on the router sticker Figure 52 5 Select Join Figure...

Страница 80: ...ecord the IP address of the iOS device because it will be necessary to refer to it in Step 12 Figure 68 Device IP Address Confirmation Screen 9 Install the VNC software by searching and installing it from the App store Mocha VNC Lite for iOS is the software used in this example Figure 69 An Internet connection is required for this step Complete instructions for installing Mocha VNC Lite for iOS ca...

Страница 81: ...analyzer s address in the VNC server address field 192 168 100 100 or 192 168 100 101 from Step 8 The IP address of the analyzer will be whichever address the iOS device is not For example if the IP address of the iOS device that was displayed in Step 8 is 192 168 100 101 then the IP address of the analyzer will be 192 168 100 100 13 In the VNC Password field enter lgrvnc 14 Select Connect The Set...

Страница 82: ...nect the iOS device to the analyzer tap the IP Config you set up The analyzer software will display on the device Figure 73 The screen size is adjustable to fit the screen of the device Figure 73 Analyzer Software Interface Screen Size Adjustment for iOS Devices ...

Страница 83: ...ws device open Wireless Router options 2 Locate the sticker on the router Figure 52 3 Click on the Wireless Network Connections icon in the bottom left of the screen Figure 74 to open the Windows Wireless Networks dialog box Figure 75 Figure 74 Wireless Connections Icon Figure 75 Windows Wireless Networks ...

Страница 84: ...ple TP LINK 775C to display the Connect to a Network dialog box Figure 76 5 In the Security key field enter the wireless password located on the router sticker Figure 52 6 Click OK Figure 76 Network Connections Security Screen 7 The Connection Status dialog box displays Figure 77 Figure 77 Current Connectivity Screen ...

Страница 85: ...he device is connected through the wireless router by selecting the router Figure 78 Figure 78 Wireless Network Connection Screen 9 Verify the IP address of the Windows device a Right click on the TP LINK 775C network connection b Click Status Figure 79 Figure 79 Current Connectivity Screen ...

Страница 86: ...10 The Wireless Network Connection Status dialog box displays Figure 80 Figure 80 Wireless Network Connection Status Window 11 Click the Details button to display the Network Connection Details window Figure 81 Figure 81 Network Connection Details Window ...

Страница 87: ... www realvnc com products vnc documentation 5 0 guides user Ch apter1 html 14 Open the program by clicking the Connect button Figure 82 Figure 82 Real VNC Viewer Installation Screen 15 Enter the analyzer s address in the VNC server address field 192 168 100 100 or 192 168 100 101 from Figure 81 The IP address of the analyzer will be whichever address the Windows device is not For example if the IP...

Страница 88: ...er and for how long By sampling references periodically during an ongoing data run you can post correct the data for long term drift when active calibration cannot be done ABB LGR offers two versions of the MIU 8 port MIU 8 16 port MIU 16 Figure 83 shows the front panel of a 16 port MIU Figure 83 16 Port MIU Front Panel Control of the MIU is unidirectional The analyzer does not receive feedback on...

Страница 89: ... the Components 1 Connect the provided power cable into the fused power entry module on the back panel 2 Connect the 25 pin control cable from the MIU to the TO MIU port on the back panel of the analyzer 3 Connect a 1 4 Teflon tube from your gas source into one of the numbered inlet ports Repeat for multiple gases 4 When connecting the tubing push the tube into the port until you feel a click in o...

Страница 90: ...menu to specify what ports are sampled and for how long Figure 85 shows the Gas Manifold Control Screen for the MIU not yet enabled Figure 85 Gas Manifold Control Screen for the MIU not yet enabled 3 Populate the unknown gas valve sequence a Valve The current valve being sampled corresponds to the port number on the MIU b Seconds How long the analyzer should sample the gas in seconds c Description...

Страница 91: ...to the port number on the MIU b Seconds How long the analyzer should reference the gas in seconds c Description Input a short text description associated with the reference gas connected to that valve 5 Click on the Start with reference gas valve sequence check box if you wish to run your reference gases first 6 Use the arrow scroll bar to select the number of times to run the unknown gas sequence...

Страница 92: ... current valve being sampled referenced and its text description is shown in the parameter window of the User Interface Control Bar Figure 87 The description is Displayed on the parameter window of the User Interface Control Bar during analysis Figure 87 Saved to a data file Figure 87 User Interface Control Bar showing MIU information 9 When sampling is complete disable the MIU by returning to the...

Страница 93: ...o Calibrate the Water Concentration 1 Connect a Dew Point Generator Licor LI 610 or similar to the inlet of the water vapor isotope analyzer 2 Set the dew point generator to 7V which is equivalent to 10 060ppm H2O 3 Once the water concentration is stable at 7V create a new data file and run the analyzer for 5 minutes to get an average value of the δD δ18 O and δ17 O isotope ratios in PP_MIL 4 Open...

Страница 94: ...ion menu Figure 89 Figure 89 Calibration menu 7 Enter the known concentration of water vapor example 10 060ppm if the Dew Point Generator is set to 7 Volts Figure 89 8 Enter the averaged values of δD δ18 O and δ17 O in PP_MIL Figure 89 9 Click the NEXT button on the lower right panel of the screen to begin calibration Figure 89 ...

Страница 95: ...ss as a flow chart Figure 90 Calibration Flow 11 When the Calibration Complete message is displayed click the CLOSE button 12 Enter TimeChart by selecting the Display button on the User Interface Control Bar Figure 88 and verify that the displayed concentration is reporting the expected value The time of latest calibration is stored in Reference Gas Settings within the Calibration menu for future ...

Страница 96: ...al hand pad to that voltage a If the WVISS is not labeled with a Calibration Voltage set the hand pad between 2 2 2 4 Volts and adjust accordingly until the analyzer is reporting 10 000ppm 4 Allow the analyzer to stabilize at 10 000ppm before calibrating 5 Click the Setup button on the User Interface Control Bar Figure 91 Figure 91 User Interface Control Bar 6 Select the Calibration tab at the top...

Страница 97: ... panel of the calibration screen as the analyzer performs the calibration Figure 93 shows the calibration process as a flow chart Figure 93 Calibration Flow 11 When the Calibration Complete message is displayed click the CLOSE button Figure 92 12 Enter TimeChart by selecting the Display button on the User Interface Control Bar Figure 91 and verify that the displayed isotope values correctly corres...

Страница 98: ...gure 96 allows for configuration and control of water vapor references that are introduced into the inlet port of the analyzer Figure 94 shows the front panel of the WVISS accessory Figure 94 Front Panel of the WVISS Accessory The Standard Range WVISS is compatible with the GLA132 WVIA analyzer Range 3000 30 000 ppm H2O Dimensions 19 17 10 Weight 60 pounds 27 kg Power Requirements 115 230 VAC 50 6...

Страница 99: ...USER MANUAL ICOS INSTRUCTIONS UM ICOS EN REV B 2 99 ...

Страница 100: ...alyzer Setup Panel Configure the analyzer to control the WVISS 1 Click Setup on the User Interface Control bar Figure 95 Figure 95 Setup Button on the User Interface Control Bar 2 Click on the WVISS tab at the top of the Setup menu selection bar Figure 96 Figure 96 WVISS Setup Screen ...

Страница 101: ...tion Figure 97 Adjustment Panel for the WVISS operation 4 In the WVISS mode pane use the drop down selection box to enable control of the WVISS Figure 98 Options include WVISS disabled Single Stage WVISS Enabled Dual Stage WVISS Enabled not compatible with the GLA132 WVIA Figure 98 WVISS Mode Drop Down Menu Once WVISS Enabled is selected the screen becomes active to allow for user configuration ...

Страница 102: ... but additional purging steps can be added before stabilizing and after the last reference flow o Purge the nebulizer before and after each sample to avoid clogging the nebulizer Stabilize o During stabilization the analyzer will not record measurements of the reference flow Reference Flow o The reference sample is measured and recorded by the analyzer The settings are recorded and saved in the la...

Страница 103: ...COS EN REV B 2 103 b Set the duration of the sample by adjusting the timing in the Seconds columns Figure 100 c Set the dilution of the sample by adjusting the voltage in the MFC mV columns Figure 100 Figure 100 Adjustment of the States ...

Страница 104: ...0V Purge for 30 seconds 4 99V automatic function hidden Reference Gas Cycle 0 6 references Purge for 30 seconds 4 99V automatic function hidden Stabilize for 30 seconds 4 99 V Reference flow for 60 seconds 4 99V Reference flow for 60 seconds 4 00V Reference flow for 60 seconds 3 00V Reference flow for 60 seconds 2 00V Reference flow for 60 seconds 1 00V Reference flow for 60 seconds 0 50V Purge fo...

Страница 105: ... Ref 0 1 start with Ref 1 c Ref 0 1 start with MIU Sample in d Ref 0 only start with Ref e Ref 1 only start with Ref f Ref 0 only start with MIU Sample in g Ref 1 only start with MIU Sample in Figure 102 Reference Cycle Order Pane 8 In the Reference cycle order pane use the arrow scroll bar to set the number of times to run Reference 1 for each Reference 0 Figure 103 Figure 103 Reference Cycle Ord...

Страница 106: ...ave Changes Figure 97 11 Click Close to begin the WVISS configured run Figure 97 a While the WVISS is operating the current status of the WVISS is displayed in the parameter window of the User Interface Control Bar Figure 105 b The data is saved to the Data File listed in the parameter window of the User Interface Control Bar Figure 105 Figure 105 WVISS Status 12 When sampling is complete disable ...

Страница 107: ...USER MANUAL ICOS INSTRUCTIONS UM ICOS EN REV B 2 107 Figure 107 shows the WVISS Disabled Figure 107 WVISS Disabled ...

Страница 108: ...ponents should be as short as possible to minimize the response time when switching channels 1 Connect your samples to the MIU inlet ports Refer to the MIU Appendix for setup 2 Connect a tube from the MIU Outlet push connect port to the WVISS Sample In push connect port on the front panel of the WVISS 3 Connect the WVISS Outlet port to the analyzer Inlet port Configure the WVISS and MIU Setup Pane...

Страница 109: ...the WVISS section of this appendix for details Figure 109 WVISS Setup Panel a Click on the WVISS tab at the top of the Setup menu selection bar to access the WVISS Setup Panel Figure 109 b Program the WVISS screen for the references c Check the Set by MIU checkbox Figure 109 i If the MIU tab has not been enabled the WVISS screen becomes grayed out and a Message Box will appear informing you to Ena...

Страница 110: ...USER MANUAL ICOS INSTRUCTIONS UM ICOS EN REV B 2 110 Figure 110 Enable the MIU message screen d Select Save Changes Figure 110 e Click Close to begin the configured run Figure 110 ...

Страница 111: ...LA132 AMA Figure 111 Figure 112 GLA132 CCIA2 Figure 113 GLA132 EAA Figure 114 GLA132 GGA Figure 115 and Figure 116 GLA132 H2SN Figure 117 GLA132 HCL Figure 118 GLA132 HF Figure 119 GLA132 HFHC Figure 120 and Figure 121 GLA132 MCEA1 Figure 122 and Figure 123 GLA132 OXCC Figure 124 and Figure 125 GLA132 SAM Figure 126 Figure 127 Figure 128 Figure 129 GLA132 SOFX1 Figure 130 and Figure 131 GLA132 SOF...

Страница 112: ...igure 111 and Figure 112 show the Spectrum Display for the GLA132 AMA Laser 1 also referred to as laser A displays CH4 and H2O peaks Figure 111 Spectrum Display for Laser 1 GLA132 AMA Laser 2 also referred to as laser B displays the C2H2 peak Figure 112 Spectrum Display for Laser 2 GLA132 AMA ...

Страница 113: ... REV B 2 113 GLA431 CCIA2 Carbon Dioxide Isotopic Analyzer Figure 113 shows the Spectrum Display for the GLA132 CCIA2 Laser 1 also referred to as laser A displays the 12 CO2 OC18 O 13 CO2 and H2O peaks Figure 113 Spectrum Display GLA431 CCIA2 ...

Страница 114: ...USER MANUAL ICOS INSTRUCTIONS UM ICOS EN REV B 2 114 GLA132 EAA Ammonia Analyzer Figure 114 shows the Spectrum Display for the GLA132 EAA Figure 114 Spectrum Display GLA132 EAA ...

Страница 115: ... Analyzer Figure 115 and Figure 116 show the Spectrum Display for the GLA132 GGA Laser 1 also referred to as laser A displays CH4 and H2O peaks Figure 115 Spectrum Display GLA132 GGA Laser 2 also referred to as laser B displays the CO2 peak Figure 116 Spectrum Display GLA132 GGA ...

Страница 116: ...USER MANUAL ICOS INSTRUCTIONS UM ICOS EN REV B 2 116 GLA132 H2SN Hydrogen Sulfide Analyzer Figure 117 shows the Spectrum Display for the GLA132 H2SN Figure 117 Spectrum Display for Laser 1 GLA132 H2SN ...

Страница 117: ...USER MANUAL ICOS INSTRUCTIONS UM ICOS EN REV B 2 117 GLA132 HCl Hydrogen Chloride Analyzer Figure 118 shows the Spectrum Display for the GLA132 HCl Figure 118 Spectrum Display for Laser 1 GLA132 HCl ...

Страница 118: ...USER MANUAL ICOS INSTRUCTIONS UM ICOS EN REV B 2 118 GLA132 HF Hydrogen Fluoride Analyzer Figure 119 shows the Spectrum Display for the GLA132 HF Figure 119 Spectrum Display GLA132 HF ...

Страница 119: ...nalyzer Figure 120 and Figure 121 show the Spectrum Display for the GLA132 HFHC Laser 1 also referred to as laser A displays HF and H2O peaks Figure 120 Spectrum Display for Laser 1 GLA132 HFHC Laser 2 also referred to as laser B displays HCl and H2O peaks Figure 121 Spectrum Display for Laser 1 GLA132 HFHC ...

Страница 120: ...lyzer Figure 122 and Figure 123 show the Spectrum Display for the GLA132 MCEA1 Laser 1 also referred to as laser A displays CH4 and H2O peaks Figure 122 Spectrum Display for Laser 1 GLA132 MCEA1 Laser 2 also referred to as laser B displays CO2 and CO peaks Figure 123 Spectrum Display for Laser 1 GLA132 MCEA1 ...

Страница 121: ...alyzer Figure 124 and Figure 125 show the Spectrum Display for the GLA132 OXCC Laser 1 also referred to as laser A displays the O2 and H2O peaks Figure 124 Spectrum Display GLA132 OXCC Laser 2 also referred to as laser B displays the CO and CO2 peaks Figure 125 Spectrum Display GLA132 OXCC ...

Страница 122: ...lfide and Ammonia Analyzer Figure 126 Figure 129 shows the Spectrum Display for the GLA132 SAM Laser 1 also referred to as laser A displays the NH3 and H2O peaks Figure 126 Spectrum Display Ambient Air GLA132 SAM Figure 127 Spectrum Display for Laser 1 NH3 at 100ppb GLA132 SAM ...

Страница 123: ...NSTRUCTIONS UM ICOS EN REV B 2 123 Laser 2 also referred to as laser B displays the H2S peaks Figure 128 Spectrum Display for Laser 2 Ambient Air GLA132 SAM Figure 129 Spectrum Display for Laser 2 H2S at 10ppm GLA132 SAM ...

Страница 124: ...Figure 131 and show the Spectrum Display for the GLA132 SOFX1 Laser 1 also referred to as laser A displays the CH4 and CO2 peaks Figure 130 Spectrum Display for Laser 1 GLA132 SOFX1 Laser 2 also referred to as laser B displays the NH3 and H2O peaks Figure 131 Spectrum Display for Laser 1 GLA132 SOFX1 ...

Страница 125: ...132 and Figure 133 show the Spectrum Display for the GLA132 SOFX2 Laser 1 also referred to as laser A displays the CH4 and CO2 peaks Figure 132 Spectrum Display for Laser 1 GLA132 SOFX2 Laser 2 also referred to as laser B displays the NH3 and H2O peaks Figure 133 Spectrum Display for Laser 1 GLA132 SOFX2 ...

Страница 126: ...EV B 2 126 GLA132 WVIA Ultraportable Water Vapor Isotopic Analyzer Figure 134 shows the Spectrum Display for the GLA132 WVIA Laser 1 also referred to as laser A displays the HOD H2 16 O and H2 18 O peaks Figure 134 Spectrum Display GLA132 WVIA ...

Страница 127: ...re listed below The isotope ratios are reported in relative to Vienna Pee Dee Belemnite converted to CO2 VPDB CO2 The standards listed below were taken from IAEA TECDOC 825 R13 VPDP CO2 0 0112372 R18 VPDP CO2 0 002088349077 Total CO2 is defined as the sum of all the isotopes CO2 16 O 12 C 16 O 16 O 13 C 16 O 16 O 12 C 18 O The isotope ratios are defined according to 𝛿13𝐶 𝑅13 𝑀𝑒𝑎𝑠 𝑅13 𝑉𝑃𝐷𝐵 𝐶𝑂2 1 10...

Страница 128: ... 𝐶 12 𝑂 18 2 𝑂 16 𝐶 12 𝑂 16 𝑂 16 𝐶 12 𝑂 18 To convert the output oxygen isotope ratios from VPDB CO2 to VSMOW use the follow formulas 𝛿18𝑂 𝑉𝑆𝑀𝑂𝑊 𝑅18 𝑉𝑃𝐷𝐵 𝐶𝑂2 𝑅18 𝑉𝑆𝑀𝑂𝑊 𝛿18𝑂 𝑉𝑃𝐷𝐵 1000 1 1 1000 To use a calibration or reference gas where the oxygen isotope ratios are known relative to VSMOW convert them to VPDB CO2 using the following formulas 𝛿18𝑂 𝑉𝑃𝐷𝐵 𝑅18 𝑉𝑆𝑀𝑂𝑊 𝑅18 𝑉𝑃𝐷𝐵 𝐶𝑂2 𝛿18𝑂 𝑉𝑆𝑀𝑂𝑊 1000 1 1 100...

Страница 129: ... ICOS INSTRUCTIONS UM ICOS EN REV B 2 129 Appendix J Cables Table 11 describes the power cables shipped with your analyzer Table 11 Power Cables Region Cable Specifications Australia and New Zealand United Kingdom ...

Страница 130: ...USER MANUAL ICOS INSTRUCTIONS UM ICOS EN REV B 2 130 Europe United States ...

Страница 131: ...egard to purchase orders the agreed particulars shall prevail ABB does not accept any responsibility whatsoever for potential errors or possible lack of information in this document We reserve all rights in this document and in the subject matter and illustrations contained therein Any reproduction disclosure to third parties or utilization of its contents in whole or in parts is forbidden without...

Отзывы: