Chapter 40 Diagnostics
ZyWALL ATP Series User’s Guide
778
40.2.1 The Diagnostics Collect Screen
When you click
Collect Now
, a series of commands are run to display information about the Zyxel
Device. This is an example of a default script with interface diagnostic commands.
You can also create your own script to display information about the Zyxel Device. This is an example of
a customized
Diagnostics > Collect
script.
Note: A script created in
File Manager > Shell Script
is used to run commands on the Zyxel
Device. A script created in
Diagnostics > Collect
is used to display information about
the Zyxel Device only. Both use a “.zysh” filename extension with a file name of up to 25
characters (including a-z, A-Z, 0-9 and ;‘~!@#$%^&()_+[]{}’,.=-). Spaces are allowed.
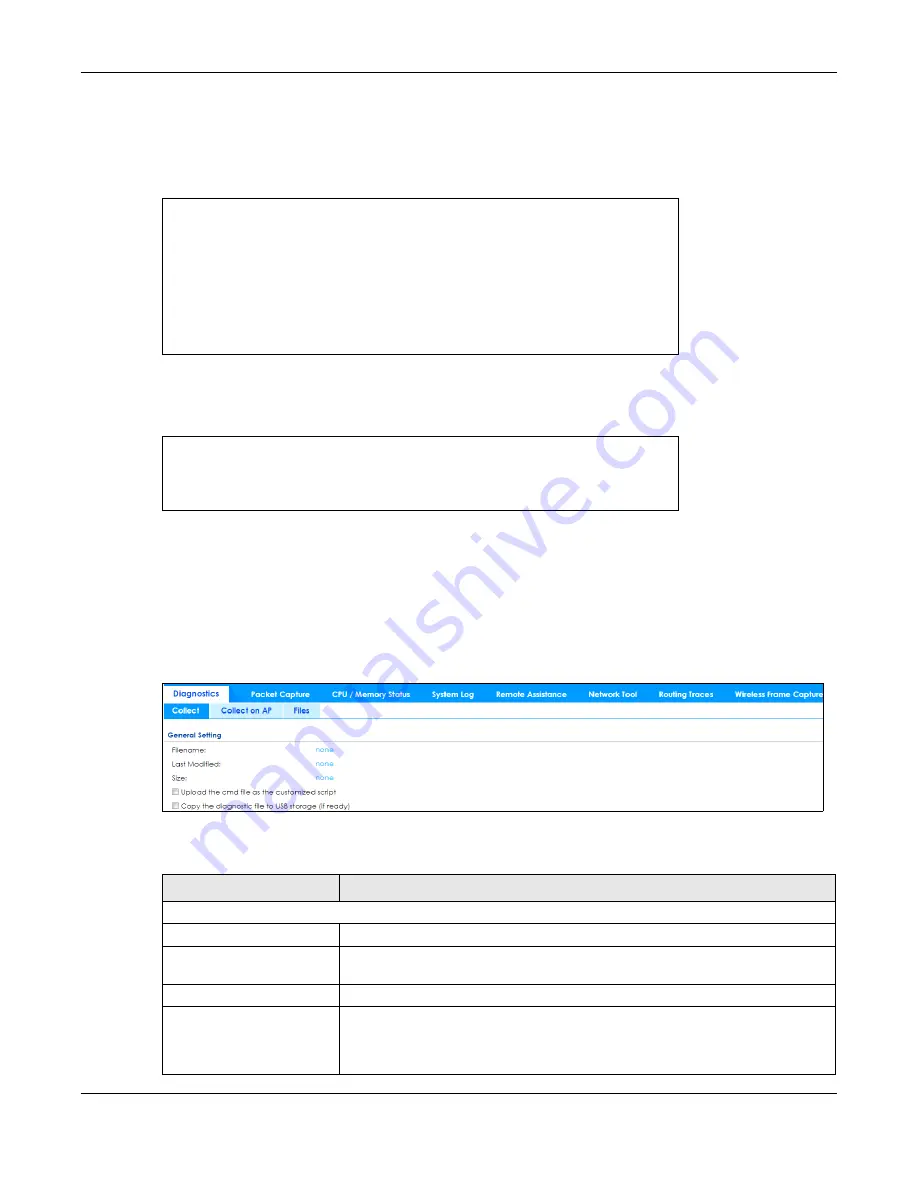
Click
Maintenance > Diagnostics > Collect
to open the
Collect
screen.
Figure 537
Maintenance > Diagnostics > Collect
The following table describes the labels in this screen.
debug interface ifconfig
debug interface show event_sink
debug interface show interface_obj
debug switch table
debug switch port_groupping
show ping-check status
debug system netstat interface
show interface all
show port status
show service-register status all
show myzyxel-service get-cloud-timezone
show cloud-helper firmware
show cloud-helper remind
Table 344 Maintenance > Diagnostics > Collect
LABEL
DESCRIPTION
General Setting
Filename
This is the name of the most recently created diagnostic file.
Last modified
This is the date and time that the last diagnostic file was created. The format is yyyy-
mm-dd hh:mm:ss.
Size
This is the size of the most recently created diagnostic file.
Upload the cmd file as the
customized script
Select this to upload a customized shell script to display information about the Zyxel
Device. Use a text editor to create the shell script files. They must use a “.zysh”
filename extension. Specify the new name for the shell script file. Use up to 25
characters (including a-z, A-Z, 0-9 and ;‘~!@#$%^&()_+[]{}’,.=-). Spaces are allowed.


