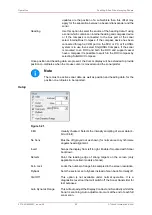
Operation
SeaKing & SeaPrince Imaging Sonars
0374-SOM-00001, Issue: 08
25
© Tritech International Ltd.
5.2.5. Dynamic Range and Sonar Rx Indicator
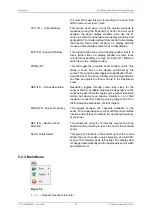
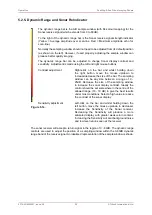
Figure 5.14.
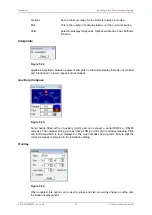
The dynamic range bar is the A/D sample window (with 64-colour mapping) for the
Sonar receive signal (which extends from 0 to 80dB).
To the right of the dynamic range bar is the Sonar receive signal strength indicator
(Yellow = Average amplitude over scan-line, Red = Maximum amplitude echo for
scan-line).
Normally the sampling window should not need to be adjusted from its default position
(as shown on the left). However, if used properly, adjusting the sample window can
produce better quality imaging.
The dynamic range bar can be adjusted to change Sonar display contrast and
sensitivity. Adjustment is made using the left and right mouse buttons.
Contrast adjustment
Right-click on the bar and whilst holding down
the right button, move the mouse up/down to
increase/decrease the size of the bar. The sampling
window can be any size between a range of 9 -
25dB. Decrease the size of the sampling window
to increase the sonar display contrast. Ideally the
control should be set somewhere in the centre of the
allowed range (16 - 18 dB) to give the best results
under most conditions. Select a high value to reduce
the contrast of the sonar display.
Sensitivity adjustment
Left-click on the bar and whilst holding down the
left button, move the mouse up/down to decrease/
increase the Sensitivity of the Sonar receiver.
Decreasing the Sensitivity will produce a more
saturated display with greater weak-return content.
Increasing the Sensitivity will omit background noise
and low level returns seen at the receiver
The sonar receiver will accept a return signal in the region of 0 - 80dB. The dynamic range
controls are used to adjust the position of a sampling window within the 0-80dB dynamic
range band of the receive signal. An idealised representation of the sample window is shown:


