83
Trend
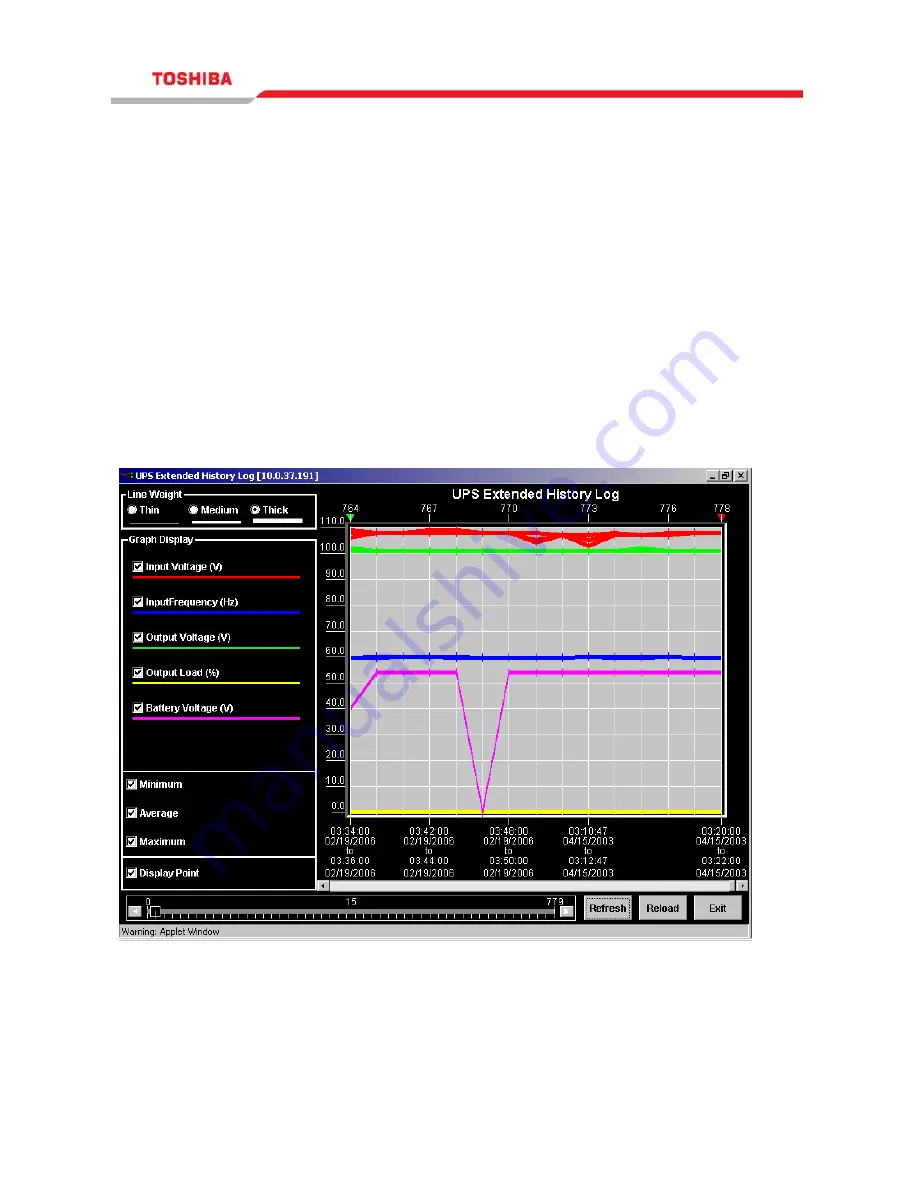
Clicking the Trend button at the top-left side of the RemotEye II home page, Figure
19: HTTP Trend Data Screen on page 83 will open in a separate window. This screen
displays the UPS history log as a line graph. By default, all the UPS parameters will
be displayed on the same graph. The user may select any combination of parameters
to be displayed on the graph by clicking the check box beside a parameter on the
monitor screen and clicking the Refresh button.
Display Point — Displays the log interval on the graph.
Refresh — Click the Refresh button after changing any settings on the UPS History
Log Monitor for the changes to take effect.
Reload — Update the UPS History Log Monitor and reset the right display margin.
Exit — Closes the UPS History Log Monitor window.
Figure 19: HTTP Trend Data Screen


