


247
3
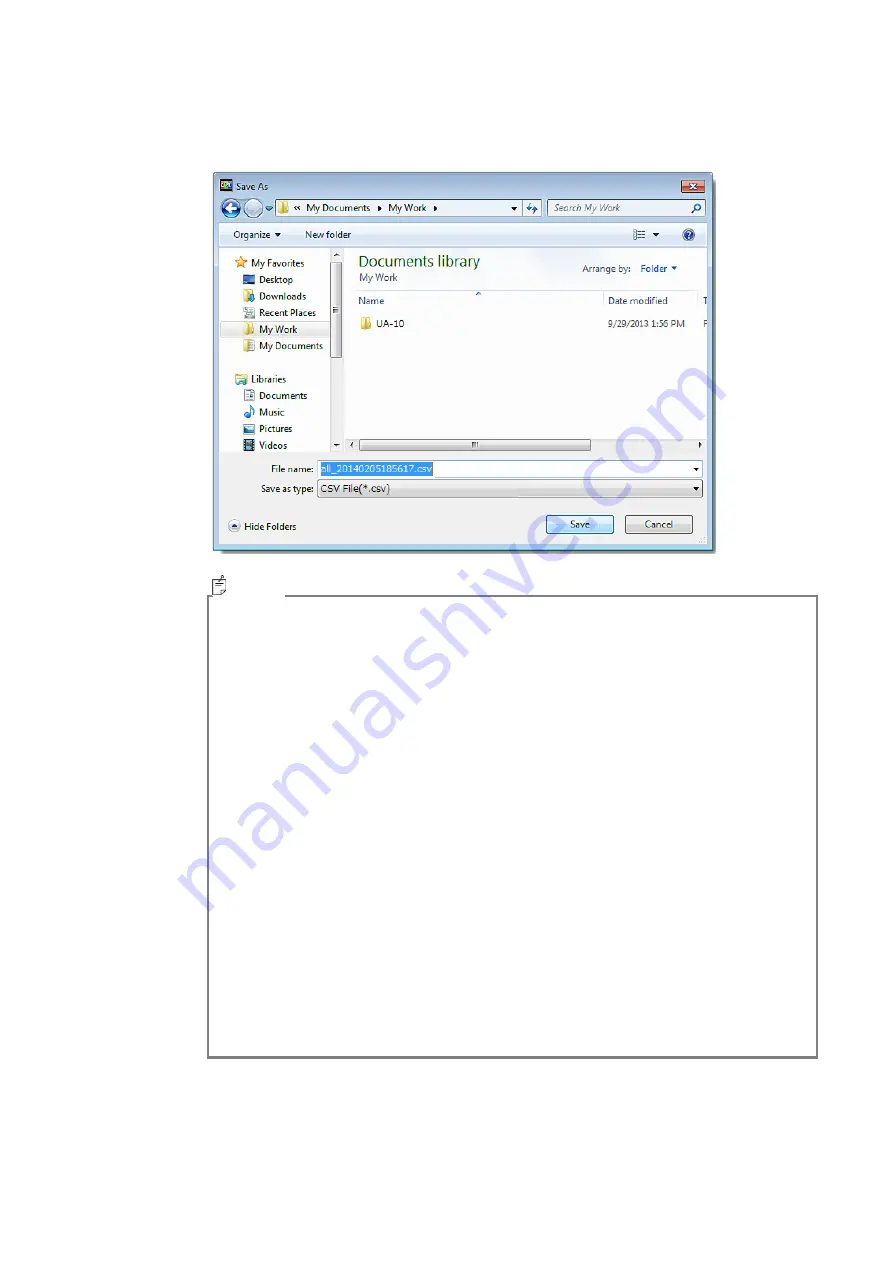
The Explorer window opens. Specify the path, file name, and file format to be saved.
[CSV] and [TEXT] file format are available.
•
The following character strings are placed on the top of the file name depending
the Views to be saved.
Random spot
rdm_
Standard spot
std_
Split spot
mtx_
Pseudo color
all_
Cross-section
sct_
RGB color
all_
Color system Pseudo color
clr_
Judgment result (random spot)
rdmj_
Judgment result (standard spot)
stdj_
Judgment result (split spot)
mtxj_
Judgment result (all pixel)
allj_
•
If the [Pseudo Color View] - [Save CSV] is selected, when the trimming area is
specified, the measurement data in only the trimmed area are saved.
•
The Tristimulus values data, in which saturation occur are
saved as “over” and The
Chromaticity values data, in which saturation occur are
saved as “error”.
•
When some item is checked in the [Recipe Setting] - [CSV Setting] process but
data does not exist for the item, a blank is saved for the item.
.
Memo
Summary of Contents for UA-10 Series
Page 2: ......
Page 19: ...17 14 5 14 5 22 12 1 4 20 UNC NUT 1004 5 6 Screw 2x5 FW x4 Screw 2x10 FW x4 7 8...
Page 134: ...132 UA 200 series 5 The Finish window is displayed Click Finish...
Page 164: ...162 4 Measured image in corrected rectangle shape will be displayed...
Page 201: ...199 2 Live View is opened...
Page 208: ...206...
Page 210: ...208 Rectangular marker area is displayed...
Page 212: ...210 3 Rectangular marker will appear...
Page 215: ...213 3 Optimization area is displayed...
Page 217: ...215 3 Optimization area is displayed...
Page 222: ...220 3 Enlarged display window appears...
Page 303: ...301 3 All the split spots are deselected...
Page 343: ...341 3 Only the center measurement spot is set All the other measurement spots are deselected...
Page 363: ...361 3 The Contour Property is displayed...
Page 374: ...372 2 The Chromaticity Diagram View is opened...
Page 380: ...378 4 Selecting 10nm Pitch displays the following view...
Page 384: ...382 4 The view returns to the original display...
Page 386: ...384 4 When Color ON is selected the Chromaticity diagram is colored...
Page 388: ...386 4 When Color OFF is selected the Chromaticity diagram is display with monotone...
Page 394: ...392 By drawing area and or child area cotinuouly overlayed areas will be built...
Page 402: ...400 4 The Chromaticity Diagram View Property is displayed...
Page 408: ...406 2 The Histogram View is opened...
Page 412: ...410 2 The Thumbnail View is opened...
Page 420: ...418 3 Scale Setting dialog will open You can change display scale of L a b view...
Page 432: ...430 3 Scale Setting dialog will open You can set scale values by key...
Page 448: ...446 3 The Time series Graph is displayed...
Page 451: ...449 Time series Measurement Random Spot List...
Page 456: ...454 4 The Pop up menu will open Select the Zoom ON 5 The specified area is enlarged...
Page 458: ...456 4 The zoomed in area returns to the original display...
Page 464: ...462 When Apply is pressed after changing the property scale the scale range is changed...
Page 495: ...493 2 From the Menu bar select Window Tile sequentially 3 The displayed views are organized...
Page 497: ...495 2 From the Menu bar select Window Close All sequentially...
Page 500: ...498 View mode UA 10 Series UA 200 Series...
Page 507: ...505 UA 200A...
Page 522: ...520 External Dimension Diagram UA 10 series Main body with Tripod screw adapter...
Page 523: ...521 Depth5 Main body with Tripod screw adapter and Spacer Mount...
Page 524: ...522 UA 200 series UA 200S UA 200AS...
Page 525: ...523 UA 200WS UA 200AWS...
Page 526: ...524 UA 200T UA 200AT...


