20
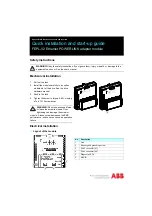
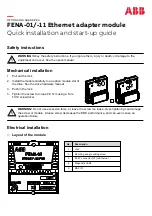
Channel 1 Switchnode voltage
Channel 2 External Clock Signal
Vin = 12V
Iout=10A
Figure 15: Synchronization
6 TPS40100EVM TYPICAL PERFORMANCE DATA &
CHARACTERISTIC CURVES
Figure 16 through Figure 18 present typical performance curves for the TPS40100EVM-001. Since actual
performance data can be affected by measurement techniques and environmental variables, these curves are
presented for reference and may differ from actual field measurements.
Summary of Contents for TPS40100
Page 4: ...4 4 SCHEMATIC Figure 1 TPS40100EVM 001 Power Stage Control Schematic ...
Page 5: ...5 Figure 2 TPS40100EVM 001 Margin Control Component values are for reference only ...
Page 16: ...16 Iout 10A Figure 11 Power on from enable ...
Page 24: ...24 Figure 19 TPS40100EVM 001 Component Placement Viewed from Top ...
Page 25: ...25 Figure 20 TPS40100EVM 001 Silkscreen Viewed from Top ...
Page 26: ...26 Figure 21 TPS40100EVM 001 Top Copper Viewed from Top ...
Page 27: ...27 Figure 22 TPS40100EVM 001 Layer 2 X Ray View from Top ...
Page 28: ...28 Figure 23 TPS40100EVM 001 Layer 3 X Ray View from Top ...