12
3: The Screen and Basic Concepts
3.1 Softkey Interface
The column labeled “softkeys” in
mirrors the set of buttons on the test set front panel
on page 4 shows them side by side). The labels indicate the effect pressing the
corresponding button will have.
The function of a softkey changes depending on previous selections including navigation and
settings. Highlighting is used to represent state information, to invite navigation into a submenu, or
to return to a previous menu. The softkey interface can be used to configure all aspects of the test
set, except the
. It is described in detail in the sections that follow.
A USB mouse can be used to press and release softkeys. To execute the function currently
assigned to a softkey, click on it. Some softkeys repeatedly execute their function while held
down. These keys are noted as they are described in this manual. Pressing (and holding) the mouse
button on a softkey repeatedly executes its function as well. Using the mouse to interact through
the softkey interface is also useful because it minimizes physical disturbance to the test set.
Physical disturbance can affect the accuracy of sensitive measurements.
3.1.1 Navigation
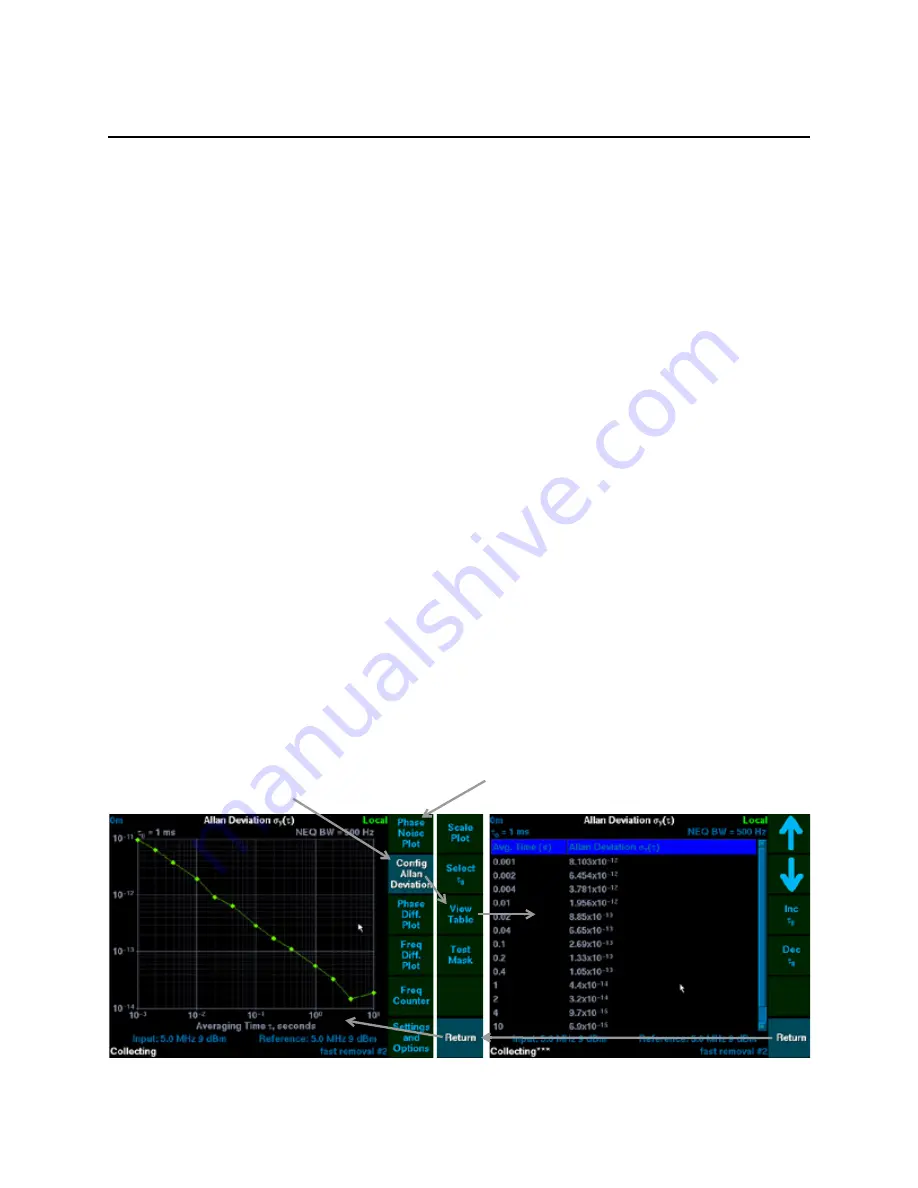
Starting with the phase noise plot as shown in
, pressing the
Allan Deviation Plot
button
would:
Display the Allan deviation plot.
Change the softkey’s caption to
Config Allan Deviation.
Highlight the softkey to show that Allan deviation is the active mode.
Pressing the same button at this time will enter a softkey menu (center in the figure below) that
allows for scale and test mask configuration,
τ
0
selection, or viewing the Allan deviation in table
format. This softkey menu has a highlighted
Return
softkey to return to the previous menu.
shows the flow from the Allan deviation plot, to its table format, and back to the plot.
.
Figure 4: Softkey Navigation
The top softkey now reselects the phase noise plot. Its
original function was to configure the phase noise plot.
The second softkey now configures the Allan deviation
plot. It was just used to select the Allan deviation plot.
Summary of Contents for 5115A
Page 6: ...iv Contents Index 97 ...
Page 12: ...6 1 Introduction ...
Page 16: ...10 2 Setting Up a PNTS ...
Page 26: ...20 3 The Screen and Basic Concepts ...
Page 82: ...76 9 Maintaining a PNTS ...
Page 92: ...86 Appendix A Specifications ...
Page 98: ...92 Appendix B Theory of Operation ...
Page 100: ...94 ...
Page 102: ...96 ...
Page 106: ...100 ...