Operating Manual
36
1300-87076-1A Rev. 1
Table 20. Sample data tab page information.
Features
Description
A---
These columns will automatically turn to the user-defined wavelength after finishing
the protocol setting on the
Custom Setting
tab page. After measuring samples, it will
show the absorbance of the samples in user-defined wavelength.
Name
The sample name can be inserted here. The default is Sample.
Pathlength
The light path chosen by the pathlength selector will be detected automatically and
length will be shown here.
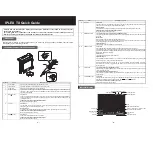
The table tab page (Figure 33) will show all the data results. If the user needs to know more details of one data
item, tap the check box column to select the data. The detail will be shown on the
Data
page and the
Graph
page.
Figure 33. Table Tab Page
Tap the
Sample
column to change the sample name. The
Blank
can also be renamed, but this is NOT
suggested. You need to measure the
Blank
again if the original blank data has been renamed.
Note
: Only one data item can be checked at one time.
Figure 34. Graph Tab Page
The graph of measuring samples can be enlarged or minimized. The axis can be moved by dragging the graph.
Long press the x- or y-axis on the graph to turn the modified graph back to default.
8.3.2 Protocol Operation
1. On the main menu, select the
More Assays
icon then the
UV-Vis
icon to enter the protocol section.