background image

ECDIS-E User Guide 


Targets 

65934012 


9-29 

Activation Zones 

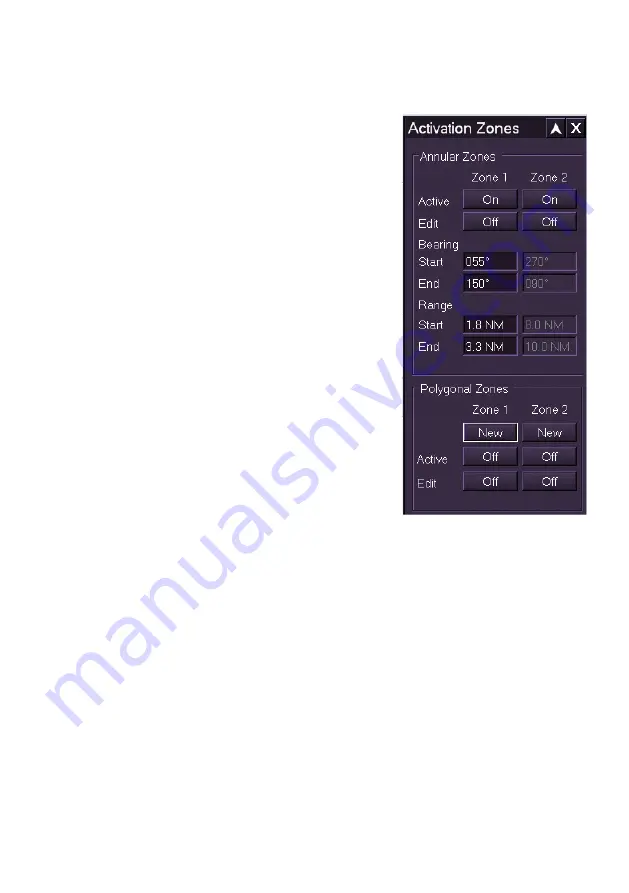
An activation zone is a defined annular or 
polygonal area of the display. Targets that 
enter an activation area are automatically 
activated and an AZ Entry alarm is raised. 

There are two annular and two polygonal 
activation zones available, which can be turned 
on and off. The annular zone parameters are 
edited from the 

Activation Zones

 window, or 

on the display; the polygonal zone parameters 
are created and edited only on the display. 
When an activation zone is active the zone 
parameters are shown on the display as a solid 
green line. When an activation zone is being 
edited its line colour changes from green to 
light purple. 

Any targets found in an activation zone are 
marked by a flashing activation zone symbol 
(see AIS Target Alarm States in AIS Targets) 
and an 

AZ Entry

 alarm is raised. The activation 

zone symbol is turned off when the AZ entry 
alarm is acknowledged, or the zone is turned 
off. The activation zone symbol is temporarily 
turned off if the zone is being edited. 

There is a limit on the number of targets within all active zones. An 

AZ Full


alarm is raised when the next target enters the zone after the limit has been 
reached. The AZ Full alarm is cleared when the number of targets falls 
below the limit. 

Summary of Contents for VISIONMASTER FT ECDIS-E

Page 1: ...ECDIS E User Guide Northrop Grumman Sperry Marine B V Part Number 65934012...

Page 2: ......

Page 3: ...Marine B V Northrop Grumman Sperry Marine B V provide a limited licence for the user to reproduce this material for their own internal purpose and use but not for distribution to third parties Reprod...

Page 4: ...Intentionally Blank...

Page 5: ...nning program that includes up to date virus definitions Also the external device media should be reserved for use with VisionMaster PCs with use on other computers kept to an absolute minimum VMFT US...

Page 6: ...configurations of the VisionMaster FT ECDIS E system This manual is intended for an operator using the VisionMaster FT ECDIS E and is divided into the following chapters and appendices Chapter 1 Over...

Page 7: ...ROVIDED BEFORE USING THE EQUIPMENT THE USE OF THIS EQUIPMENT INDICATES YOUR ACCEPTANCE OF THE TERMS OF THE LICENCE AGREEMENT The EULA is available to view in the ECDIS E Ship s Manual 65934011 Preambl...

Page 8: ......

Page 9: ...Procedures 2 5 System Security 2 6 ECDIS E Screen Layout 2 7 Main Menu and Sub Menu Area 2 7 Upper and Lower Toolbar Areas 2 8 Chart Display 2 8 Accessing System Functions 2 9 Upper Toolbar Functions...

Page 10: ...on Data affecting Own Ship Symbol 3 4 Own Ship Vector 3 5 Predicted Vector 3 6 Cursor Readout 3 7 Position 3 9 Sensor Data Display 3 12 Dual Node Support 3 13 Presentation Modes 3 14 Presentation Mode...

Page 11: ...3 34 Maximum View 3 34 True Motion Limits 3 35 Displaying the TM Limits 3 35 Setting the TM Limits 3 35 Re sizing the TM Limits box 3 36 Current Date and Time 3 38 Range Rings 3 39 Brilliance Control...

Page 12: ...date Error Messages 4 13 Chart Installation 4 14 Importing Charts 4 14 Chart Copy 4 16 Permissions User Permits 4 18 Chart Index 4 21 Chart Settings 4 24 Layers 4 25 Symbology 4 26 Chart Projections 4...

Page 13: ...hived 4 66 Chart Query 4 67 Query Features 4 68 Query Results 4 68 Query Options 4 70 Chart Query on AIO Data 4 70 Chart Dangers 4 72 Chart Dangers Information 4 73 Danger Settings 4 74 Chart 1 4 77 C...

Page 14: ...itoring Clearing Lines 5 18 Import Export Clearing Lines 5 19 Line Of Position 5 21 Creating LOPs 5 22 LOP Fixes 5 24 Using a LOP Position Sensor 5 25 Optional Optical Bearing Sensor OBD 5 26 Ownship...

Page 15: ...of Turn Values 6 13 Date and Time 6 13 Wind Values 6 13 Chapter 7 Alerts Alerts 7 1 Prompts 7 2 Alert Status Indicator 7 3 Alert Status 7 4 Alert Display 7 5 Viewing Alert Details 7 6 Hide Acknowledge...

Page 16: ...ute 8 30 Route 8 31 Dangers 8 37 Critical Points 8 38 ETA Calculator 8 39 Route ETA 8 41 Required Speed 8 42 Route Status 8 43 Temporary Routes 8 44 Creating and Editing a Temporary Route 8 44 Monitor...

Page 17: ...utomatic Sorting of Targets 9 17 Selecting Targets for the User Folder 9 18 Viewing Target Data from Multiple Targets 9 18 Target Display 9 19 Target Display 9 19 Identification 9 19 Past Position Dot...

Page 18: ...d Bearing Lines Creating an ERBL 10 2 Changing the ERBL Bearing 10 3 Changing the ERBL range 10 3 Off Centring Carrying and Dropping an ERBL 10 5 Dropping an EBL VRM on the Display 10 7 Variable Range...

Page 19: ...t Profiles 13 6 View Edit Profile Selection 13 6 View Edit Profile Editing 13 7 Options 13 9 Diagnostic Functions 13 10 Diagnostics 13 10 Report 13 11 DataLog 13 14 Sensor Status 13 16 Connection Stat...

Page 20: ......

Page 21: ...ball interface which is connected to the PC a two node system where two VisionMaster monitor panel PCs are connected so that data input to one node is available to the other Either a single or two nod...

Page 22: ...c area of the chart display to zoom into Display Features A north arrow pointed true north in the upper left corner of the chart window Scale and latitude bars drawn vertically 2 to 4 mm from the left...

Page 23: ...ERBL 1 and or ERBL 2 Extensive alert indications Alarms Warnings and Cautions Displaying the current unacknowledged alert with highest priority in the alarm status indicator Facility for acknowledgin...

Page 24: ...Display information on unit groups user profiles diagnostics and commissioning Diagnostic facilities Generate a report and export the report file View Datalog files and export the datalog as a zip fi...

Page 25: ...e following topics are covered System startup and Security features typical layout of an ECDIS E display and access to System Functions a description of fixed and movable windows in the ECDIS E displa...

Page 26: ...nge to a green colour and illuminate constantly To turn the unit on verify that the On Off symbol is illuminated in red touch the symbol and hold until the symbol is illuminated in green or an image a...

Page 27: ...is powered Trackball Controls The trackball assembly comprises a trackball with two associated keys left and right The trackball controls the position of the screen cursor Selections are made by posit...

Page 28: ...match the system will not be authorized and will run in a degraded state For further information see System Security Starting up the software takes approximately 1 minute Soon after the system is pow...

Page 29: ...sources for navigation data are indicated to the right of the displayed sensor data For information on sensor source selection see Sensors Menu On the chart display the colour of the Ownship symbol o...

Page 30: ...de system both nodes have a Security Block attached If the Security Block becomes damaged or detached while the system is running an Authorization Failure alarm is given The system will continue to op...

Page 31: ...low The control functions for an ECDIS E can be divided into the following areas Main Menu and Sub Menu functions auto show hide Upper Toolbar Area fixed Lower popup Toolbar Area auto show hide Main M...

Page 32: ...stem operation From both the upper and lower toolbar areas various popup windows can be opened for access to system functions see Controlling Popup Windows Chart Display The ECDIS E has the capability...

Page 33: ...s Scale Ratio Up Down buttons Alert Acknowledgement Buzzer alert On Off Watch Mode to select the console view To access the following control windows left click on these upper toolbar buttons Target f...

Page 34: ...Cursor Left click on a function button to display context sensitive Help for that function To access the following popup windows left click on these lower toolbar buttons CURS for Cursor status POSN f...

Page 35: ...previous window open move it to another position on the display see Controlling Popup Windows each displayed function is highlighted in the sub menu navigation list To remove the function window from...

Page 36: ...Adjust EBL VRM1 Off centre Own Ship Pan Goto Zoom Here Chart Legend Query Chart select a chart object There may be additional options available when right clicking in the chart display dependant on t...

Page 37: ...xpand a previously collapsed window click on the button The control area of the window re appears 3 To close a window click on the button The window is removed from the display ECDIS does not limit th...

Page 38: ...When the cursor is moved near to the edge of the chart window it changes from an orange cross to the following symbol When the cursor moves over the dividing line between the primary and secondary win...

Page 39: ...the letters DEL appear below the cursor When the iHelp button is selected and the cursor moves over screen functions it changes to the following symbol When the cursor moves over an Electronic Bearing...

Page 40: ...ction appears in a movable window on the chart display Accessing the Help Guide The Help Guide can be accessed by clicking on the Launch Explorer button at the bottom of the Help window This window ca...

Page 41: ...ECDIS E 65934012 2 17 Accessing Tool Tips As the screen cursor moves over the system function buttons the text in the highlighted button changes from white to yellow and a tool tip for that function...

Page 42: ...clicking the OK button or if the action is to be cancelled the Cancel button is clicked If the action requested by the operator cannot be done the system displays the reason for not proceeding with t...

Page 43: ...VisionMaster FT application and the Windows operating system to power down To shut down both nodes select Shutdown All Systems A prompt appears requesting a confirmation of the shutdown to be entered...

Page 44: ......

Page 45: ...play Presentation Modes Motion Mode including setting True Motion limits Vector Modes Scale Ratio Chart Database Sub Menu Selection access to Target Display access to AIS Display access to Own Ship AI...

Page 46: ...ring of the HL or SL is dependent on the presentation mode In Course Up C UP mode the lines are initially drawn vertically and then change dependant on the current heading bearing this mode is not ava...

Page 47: ...d beam line The circle symbol is displayed in white in all day night modes apart from Day Bright when the symbol is displayed in black Outline Symbol This symbol represents a true scale outline of own...

Page 48: ...l be unavailable The custom symbol is displayed in addition to own ship minimised symbol heading line and beam line Ship s Symbol Colours The colour of the ship s symbol and heading line beam line is...

Page 49: ...current heading shown on the sensor data display Own ship vector is not drawn if Predicted Vector is enabled see Display Settings Ownship and the stabilisation mode is ground based In water stabilise...

Page 50: ...er Guide 3 6 65934012 Predicted Vector Predicted vector is a tool to indicate where the ship will go based on current speed course and rate of turn Predicted Vector is turned on and off from Ownship t...

Page 51: ...position displayed as true or relative by clicking on the T or R toggle button Reciprocal bearing defined as bearing from the cursor position to the CCRP displayed as true or relative by clicking on t...

Page 52: ...ed from a valid sensor data source the values are displayed in green if the position data is degraded then the values are displayed in yellow if the position data is considered invalid and unusable th...

Page 53: ...cludes the following data The Latitude and Longitude L L position of the CCRP as reported by the Position sensor Where the L L data is acquired from a valid sensor data source the values are displayed...

Page 54: ...ears in the field but L L values change to degraded colour yellowish orange A Loran C device or an older GPS device may not provide position using the GGA sentence In this case the GLL sentence may be...

Page 55: ...raded colour yellowish orange The field to the right of the quality indicator denotes the datum used for position data defaults to WGS84 For information on WGS 84 datum see Factors affecting Chart Acc...

Page 56: ...eading direction as indicated by the Heading Line course and speed through water and over ground as indicated by the selected sensor A readout of true heading is always displayed unless compass alignm...

Page 57: ...click anywhere within the two field blocks on the sensor data display or right click on the display and select from the drop down list the current stabilisation mode is shown ticked The selected bloc...

Page 58: ...pointing vertically The ship s heading marker is shown at the appropriate bearing North Up is the only presentation mode that can be selected when a usable source of heading data is unavailable Course...

Page 59: ...presentation mode is dictated by the orientation of the currently loaded chart If the displayed chart is a north oriented raster chart then North Up will be the only available presentation mode If the...

Page 60: ...Longitude L L positional updates to it All stationary items i e items with constant L L coordinates remain in a fixed position on the screen and all targets move according to their true course and spe...

Page 61: ...m condition Non flashing green Target with unacknowledged alarm Flashing red Non dangerous target with acknowledged alarm Non flashing green Dangerous target with acknowledged alarm Non flashing red F...

Page 62: ...screen cursor over the Vector mode selection button 2 Consecutive left clicks will toggle the mode between True T and Relative R vectors 3 Or right click on the current vector mode and select from Tr...

Page 63: ...argets To change Vector Time do the following Either 1 Position the screen cursor over the vector time field 2 Left click to edit The text becomes green editable 3 Move the trackball left to decrease...

Page 64: ...is automatically changed to match the compilation scale of the chart cell To view or select the current compilation scale right click on the scale ratio button The drop down window shows the current...

Page 65: ...Presentation Options you can select different scale ratios for the primary window and secondary window AUTO scale selection is not available in a secondary chart window Zoom Window The zoom feature en...

Page 66: ...see Setting True Motion Limits 5 To re apply TM limits to the chart window either click on the TM Limits Off button or the Centre button The chart window is re drawn with own ship in the centre of th...

Page 67: ...program see Appendix A Chart Installation in Chapter 4 Charts The Chart button enables the system to switch between chart databases and available charts or to switch charts off The button also enable...

Page 68: ...ssage No Chart is displayed on the chart button and only navigational tools will be displayed 3 To select another chart click on the chart set line in the list The scale ratio changes to the selected...

Page 69: ...isplay of AIS targets to be switched on and off When the Display Targets check box is ticked the Target Display button is shown in a lighter tone For information on the Target Display sub menu and oth...

Page 70: ...s through the AIS button and all AIS targets are removed from the chart window AIS transmissions will continue to be stored so that known targets can be rendered quickly when the AIS display is re ena...

Page 71: ...om an external source for example another ship in the area When a message has been received the Message envelope icon on the upper toolbar is displayed in orange with a white outline an audible indica...

Page 72: ...cal Split Screen Horizontal and Picture in Picture modes To return to the primary display when a split screen or picture in picture presentation is enabled click the single chart button Picture in Pic...

Page 73: ...in Secondary Chart Windows The following functions are available in secondary chart windows and can be changed independently of the current settings in the primary display Scale Ratio the AUTO scale...

Page 74: ...n to the centre of the display by using the location s Latitude LAT and Longitude LON coordinates or by selecting a previously saved location When Pan or Goto positioning is selected the TM limits are...

Page 75: ...m the window The selected position is moved to the centre of the screen Own ship and all other chart and target positions are also moved in accordance 3 To cancel the operation and remove the window f...

Page 76: ...ons field 3 To create a new location based on the L L position click on the Create button the new location name field shows Auto Generate Name To generate a location name based on the current date and...

Page 77: ...ting location 1 Select the location name to be renamed by clicking on the Locations drop down arrow 2 With the location shown in the field click the Rename button 3 The Goto window prompts to rename t...

Page 78: ...True Motion Limits All other chart data and target positions are also moved in accordance The Centre and MAX view actions can be independently applied to a specified chart display A secondary display...

Page 79: ...isplay the box right click on the Motion Mode button and select Show TM Limits the TM limits box is displayed for about three seconds Setting the TM Limits The size and location of the TM limits can b...

Page 80: ...n ship remains in the position previously set when the box was resized Click on the Centre button in the lower toolbar to move CCRP to the centre of the chart display Re sizing the TM Limits box When...

Page 81: ...ECDIS E User Guide Basic Operation of ECDIS E 65934012 3 37 TM limits can be adjusted independently for both display modes see figure below...

Page 82: ...splays the date year and the current time in hours minutes and seconds The current date and time shown are displayed as either UTC or local time dependent on the current time selected in Time Manageme...

Page 83: ...n own ships CCRP and are equally spaced Range rings are drawn out to the edge of the display irrespective of the range scale or any offsetting of the CCRP The range ring interval is dependent on the c...

Page 84: ...r the Brilliance menu To view the options right click on the icon the following selections are available from the list change of day night settings with the current setting ticked see Day and Night Mo...

Page 85: ...splay settings to the currently enabled chart display To apply a profile left click on the Profiles button and select the profile from the list at the top of the fly out When a profile has been applie...

Page 86: ...om Here from the semi transparent window A dotted rectangle box appears centred where the right click action was made The proportions of the zoom box are directly proportional to the chart window 3 To...

Page 87: ...and above the NM bar is not shown Display Base All synthetics on the screen can be temporarily suppressed retaining only chart related information contained in ECDIS base display mode Suppression of s...

Page 88: ...ve the cursor to the lower popup toolbar area left click and hold the left key down on the Display Chart button All non chart synthetics on the screen are suppressed All synthetics on the screen are s...

Page 89: ...fines dangerous objects as either Chart Dangers or Chart Cautions see Chart Dangers The display of ownship s safety region is controlled from the Local Display area of the Chart Dangers menu In additi...

Page 90: ...O THE OWN SHIP BASED SAFETY CHECKING THE OPERATOR SHOULD REVIEW THE DANGERS LIST PROVIDED ON THE DANGERS TAB OF THE MONITOR ROUTE MENU WHENEVER A NEW ROUTE IS LOADED AND PERIODICALLY DURING THE ROUTE...

Page 91: ...warning is raised for all chart dangers or cautions found on all nodes during the safety checking operation One node on the system is designated as an arbiter for Chart Dangers announcements Chart Da...

Page 92: ......

Page 93: ...Databases view detailed read only information about the chart currently displayed see Chart Legend manage manual updates to charts see Manual Chart Update highlight and view information on specific ch...

Page 94: ...to display the sub menu options Or 2 Click on the Chart button in the upper toolbar see Chart Database Sub Menu Selection The Chart button identifies the currently loaded chart database type e g C Map...

Page 95: ...detailed description of the chart databases available from the SevenCs and C MAP chart engines refer to Chart Databases When S57 charts are installed the ENC data undergoes a conversion process The re...

Page 96: ...ly accurate throughout the geographical area covered by the chart Datum discrepancies become more important when using larger scale charts When displaying a chart that was created using a datum other...

Page 97: ...ed below and a permanent indication in orange lettering at the top right of the chart display below the Watch mode button Display Overscale Prompt The display overscale prompt appears as Primary Displ...

Page 98: ...ailable Prompt The Larger Scale Chart Available at Ship prompt is shown when the largest scale chart under the ships position considering ALL enabled chart databases is not displayed Chart Safety Info...

Page 99: ...ch as buoys lighthouses and pilot stations that appear on the paper chart Because the chart is not based on an underlying database individual chart features cannot be turned on and off Selecting Raste...

Page 100: ...he area the chart covers When a raster chart is selected the chart is ticked on the drop down list the chart button shows the chart type and depth unit e g ARCS Metres and the chart is displayed on sc...

Page 101: ...l be the only available presentation mode Implementing any changes to shallow deep shading values see Chart Depths Heights WARNING ALTHOUGH SHALLOW DEEP SHADING VALUES AS DEFINED IN CHART DEPTHS HEIGH...

Page 102: ...e ARCS ENC chart databases can installed via the ChartHandler utility CAUTION Switching to the Chart Installer utility requires shutting down all navigation functions at the workstation For informatio...

Page 103: ...manual chart updates click on the drop down list Please note that the Chart Updates Summary list may take a while to populate The information shown in the summary report for each of the update files...

Page 104: ...ates button to update the list to include in the list chart updates made on other nodes While updating the table shows the message Updates Data Loading Please Wait Viewing Manual Chart Updates To view...

Page 105: ...date charts are installed from the latest set of Base CDs followed by the most recent Update CD this must be more recent than the Base CD Once the Base Update installs are complete view the charts in...

Page 106: ...ad charts a VM Security Block sometimes referred to a dongle must be connected to one of the available USB sockets at the rear of the PC The VM dongle identifies the particular product type for the wo...

Page 107: ...nstalled ARCS or ENC 2 To select a chart database tick the check box and click the Launch ChartHandler button An Action Required window will appear to advise that the active database must be used for...

Page 108: ...activate the copied charts A C Map database must be initially installed and registered locally at each node before Chart Copy for C Map charts is started To copy a chart database to other nodes do the...

Page 109: ...on the system click the Copy Local Charts to All Nodes button 3 When the copy process is started the Status column provides current information about the progress of each active copy operation If a c...

Page 110: ...t button The subsequent window displays the external disk drive and prompts to choose the location to export the S 63 permit 3 Navigate to the location where you want the permit exported to by clickin...

Page 111: ...on the button to the left of the directory folder 4 To enter a name for the hardware ID file click in the Filename field and enter a name using the screen keypad 5 With the export location highlighte...

Page 112: ...ry folder 4 To enter a name for the hardware ID file click in the Filename field and enter a name using the screen keypad 5 With the export location highlighted and a name entered click the Export but...

Page 113: ...be changed by clicking on the column headings For example clicking on the Scale heading will list charts starting from the lowest compilation scale see Chart Facility or clicking on the Issue Date col...

Page 114: ...hart boundary is dependent on the chart usage level Chart Selection Individual charts may be located and identified on the chart display To select a chart tick the Chart Selection Cursor check box and...

Page 115: ...tion the following notes should be taken into consideration The function only changes the displayed location It will not necessarily display the selected chart if its database is not currently enabled...

Page 116: ...chart databases and display settings for specific charts e g C MAP or SevenCs databases from a list of available settings CAUTION The selection of chart sets and custom features only applies to vecto...

Page 117: ...onal chart settings listed under Other are selected in addition to all Standard settings To disable individual settings untick the setting s check box Or to enable additional settings tick the setting...

Page 118: ...individual settings for the required chart engine tick the setting check box A description of each function is given below the settings list when the cursor moves over the function The chart symbology...

Page 119: ...ghts so they can be distinguished from floating lights Off Light Sector Areas Highlights light sector areas regions Off 2 The light sector will be shown only if the actual light source is visible on t...

Page 120: ...ight Lines Full light sector lines displayed Off Highlight Information Additional information viewing group 31030 INFORM NINFOM Off Highlight Document Additional documents highlighted viewing group 31...

Page 121: ...t Symbol Style Selects to display paper chart or simplified point symbol styles Paper Chart Line Symbol Style Selects to display plain or symbolised line boundaries Symbolised Date Dependent Objects T...

Page 122: ...ad When Highlight Objects is enabled and the day or date range dependency selected the object is shown on the display with an orange diagonal line with a d in a small box at the end of the line All da...

Page 123: ...l Filtering Apply filtering to suppress overlapping chart symbols of the same size shape and colour in order to reduce clutter Off Text Outline Display outline around text to provide contrast On TOD l...

Page 124: ...ary projection types supported by the VisionMaster system Mercator 5 Polar Stereographic6 Mercator is the default chart projection used to display geographic areas between 0 degrees and 80 degrees lat...

Page 125: ...n is unavailable in the displayed region then the system will select an Active Projection from the available projections that are supported by the current chart engine For example if the preferred loc...

Page 126: ...is the distance from the water surface to bottom of own ship s keel plus a safety buffer against variations in the water level from the time the water was charted to the present time The safety contou...

Page 127: ...ABILITY OF USER SPECIFIED DEPTH CONTOURS VARIANCES BETWEEN DATA CONTENT ON OVERLAPPING CHART CELLS AND OTHER DATA ISSUES THE OPERATOR MUST TAKE THESE FACTORS INTO ACCOUNT AND USE ALL AVAILABLE SOURCES...

Page 128: ...field and the lowest priority at the bottom The higher a chart database appears in the enabled list the sooner it will be selected for rendering To change the chart database priority or to disable or...

Page 129: ...on When multiple enabled chart databases provide a largest scale chart with an identical scale the chart database with the highest priority is selected To enable Auto Scale Preferences to operate the...

Page 130: ...al data is not certified for safe navigational and the operator should refer to paper charts for unofficial data regions 7 Official S 57 charts converted to CMAP s proprietary chart database format 8...

Page 131: ...hart setting for the SevenCs engine see Settings Certain C Map chart databases include a combination of official and unofficial chart data see C Map chart database descriptions above While all types a...

Page 132: ...u is also available This is available when using split screen display or picture in picture display Chart Information at a Specific Point The user can access chart legend information at a specific poi...

Page 133: ...tio of the current display scale to the chart s compilation scale as shown on the Detail tab For example if a chart has a compilation scale of 74500 and the current range scale is 1 100 000 the ratio...

Page 134: ...ing viewed all component fields show No Chart Available Chart Usage Scale The chart usage scale displays the navigational purpose e g Harbour and scale of the selected chart see Compilation Scale in C...

Page 135: ...available in the chart will be selected as the actual safety contour that is displayed in the chart legend This safety contour is displayed on the chart with a bold emphasized line this line defines...

Page 136: ...e date data format provider and quality indicator safe zones within a chart area edition number and update information Geodesy The Geodesy section provides projection type WGS84 data sounding vertical...

Page 137: ...pdate action can be viewed by selecting it in the navigation tree The data listed above is displayed at the bottom of the window Panning to Update To view specific updates select the chart update from...

Page 138: ...ic data on the raster chart currently being viewed With a raster chart displayed click on the Notes tab a list of data relevant to the chart is shown To view the specific data on each note for example...

Page 139: ...Display enables the selection of chart update types and layers to be displayed Edit enables you to Create a Chart Update and Modify a Chart Update Layers enables the management of layers used for grou...

Page 140: ...name for the layer and click the Add New Layer button The layer name appears in the Layers list If more than one layer is created the field lists the layers alpha numerically 3 To enter a description...

Page 141: ...e New Object creates a new chart object on an existing chart Add Annotation Mark adds an annotation mark to an ENC chart object Add Deletion Mark adds a deletion mark to an ENC chart object Create New...

Page 142: ...s with a white highlighting Objects with point geometry are highlighted with a white box line or area objects are highlighted with small white circles at their individual points When the object is cre...

Page 143: ...position and includes the option to associate the object with the current chart by ticking the Associate with Chart check box When creating new objects for Soundings and Danger Points Underwater Haza...

Page 144: ...it and the following fields appear for the created object Position Rotation if applicable and Notes 5 When creating a buoy or a beacon an Include Light check box is included in the Settings tab Tick t...

Page 145: ...for the object position b Offset Select a range and bearing value from the current cursor position for the object position c From Chart Move the cursor to the location on the display and click at the...

Page 146: ...nd select the symbol you want to create 3 Move the cursor into the display and click in the area of the where you want the first point of the line or area positioned The first point is created as a sm...

Page 147: ...erent procedure to other types of chart symbols To create the Other Points symbols do the following 1 Select Other Points from the Type drop down list 2 Click on the Symbol Description drop down list...

Page 148: ...s with a range from 0 to 498 kn To enter a value click in the Display Label field and move the trackball left or right until the required speed is shown The display label appears to the lower left of...

Page 149: ...shown on the Sounding symbol 5 To create a date dependency for the object see Creating Date Dependent Objects 6 To exit Create Chart Update mode click the Done button the symbols created are fixed in...

Page 150: ...ssigned the object is hidden on the display To locate a date dependent object do the following When a future date is assigned to a chart object the object symbol is removed from the display until the...

Page 151: ...the selected chart object To annotate a chart object do the following 1 Click on the Add Annotation Mark button the following screen prompts to select the chart object to annotate 2 Move the cursor o...

Page 152: ...ne the white line changes to an orange dotted line annotation mark The Chart Update View Edit window confirms the annotated symbol status The object data shown is the same as shown previously in the C...

Page 153: ...ds for the selected object The fields available are dependent on the type of object selected To edit the object s attributes 1 To associate the chart update with the current chart tick the Associate w...

Page 154: ...ck on the Done button The chart object is updated Deleting a Chart Update To delete a chart update do the following 1 Click on the Delete Chart Update button The folder prompts to select the object yo...

Page 155: ...Displayed Types lists all the object types that can be selected from the Type drop down list in the Chart Update Creation window see Create Chart Update Manual Chart Updates will be displayed when the...

Page 156: ...to the USB connector on the trackball If no external device has been inserted the window prompts to insert removable media 2 Navigate to the directory where the chart updates reside The field below t...

Page 157: ...art update objects on a specific layer 3 If Objects in Area is selected the LAT LON fields for Southwest corner and Northeast corner appear with all values defaulting to zero Define the geographic are...

Page 158: ...ee months The Archived list shows the chart object and its associated chart To view a detailed description of each object highlight the object line To restore the archived objects to the chart tick th...

Page 159: ...the object information when Query Chart is activated When a query is activated the selected object line or area is highlighted with a suitable graphic For a description of the different object types...

Page 160: ...re selected from the Results list Attribute values and definitions connected with chart objects are provided in the Results tab folder in short form only for ease of viewing Full and comprehensive def...

Page 161: ...to a below the cross the next left click enables you to query objects directly on the screen After approximately 15 seconds of inactivity the Query On cursor times out and reverts to Query Off 4 To cl...

Page 162: ...rt display The default values for query area size are as follows Small 10 of the scale ratio Medium 20 of the scale ratio Large 30 of the scale ratio Chart Query on AIO Data When the AIO checkbox is t...

Page 163: ...nd a grey dotted pattern fill 2 When the AIO object is selected in the Results tab of Chart Query the Show File button becomes enabled 3 Click the Show File button A secondary window opens showing det...

Page 164: ...ITH When safety checking detects a dangerous object a red flashing Chart Dangers alarm appears in the Alarm Status Indicator and the Dangers icon to the right of the Alarm Status Indicator is displaye...

Page 165: ...gerous object last overlapped Chart Dangers Information The chart dangers information area at the bottom of the window gives detailed information on each dangerous object selected This information wil...

Page 166: ...ted across all nodes WARNING PROFILES THAT ADJUST LOOK AHEAD TIME BUT NOT LOOK AHEAD DISTANCE WILL HAVE NO IMMEDIATE EFFECT ON THE SIZE OF THE SAFETY CHECKING REGION IF LOOK AHEAD DISTANCE IS CURRENTL...

Page 167: ...tions in the ship s course Added Breadth enables a safety region width to be added to either side of own ship s beam The value defines the safety breadth from ship s beam in metres that the system che...

Page 168: ...ty region taking into account the different COG and HDG values If the COG and HDG bearings are the same the safety region rectangle is drawn as straight lines An ownship safety contour can be switched...

Page 169: ...Ship s Manual 65934011 In order to improve usability of the ENC the presentation of the SevenCs Chart 1 Catalog has some minor deviations from the S 52 Presentation Library edition 4 0 which have been...

Page 170: ...o the brightness and contrast settings on the monitor will enable the SENC data such as coastlines safety contour and other objects to be adequately displayed To access click on the Color Diagram butt...

Page 171: ...Installing C MAP Charts CAUTION Anti Virus Protection Before connecting an external device such as a USB memory stick or a CD DVD drive to the Panel PC or Trackball it is important that the external d...

Page 172: ...nal device memory stick CD DVD or external hard drive containing the charts to be installed into the VMFT PC 2 From the Chart Handler screen open the Setting tab and tick the Scan local path check box...

Page 173: ...d 6 Select the chart source directory and click the Choose button The Select Folder window is removed 7 Open the Install tab and click the Scan Drives button The chart data including chart permits are...

Page 174: ...ton will become grey 10 Once the Apply button is greyed out click on the Exit button to exit the ChartHandler application The ChartHandler application will shut down and the VMFT will automatically re...

Page 175: ...an local path in the Drives tab and click the Browse button to navigate to the file 2 With the permit file selected install the file by clicking the Scan Drives button in the Install tab folder When i...

Page 176: ...u are using NAVTOR NavSync NavStick to update your ENC Charts the permit file s are located in NavStick INFO NAVTOR PERMITS Both the CD and NavStick include separate folders for each system you have o...

Page 177: ...n the NavStick To install NAVTOR charts do the following The chart installation process described below is identical for BASE UPDATE and USB media 1 Insert the ENC chart CD DVD or NavStick into your E...

Page 178: ...ionMaster FT ECDIS E Ship s Manual 6593411 EToken registration should be run only once after the C Map eToken has been installed into the PC Accessing Chart Installation for C Map To access the C Map...

Page 179: ...nclude any current C Map databases the only actions available from the subsequent C Map Installation program are Install From DVD or Install From Removable Storage When one or more C Map databases hav...

Page 180: ...te 4 Click the OK button to complete the installation and remove the CD DVD from the drive To install chart databases from a USB storage device memory stick or external storage device 1 Install the de...

Page 181: ...ears showing the indexing progress Charts will not be re indexed if the regional zones covered by the license have not changed For example if a license with a later expiration date is imported the reg...

Page 182: ...emoved the affected database is automatically re indexed to reflect the new set of licenses Create Update Order To create an update order for a chart database 1 Insert an external USB device into the...

Page 183: ...eceived from the C Map Updating Service emails to a removable device such as a USB memory stick 2 Select the database from the C Map Database table that the updates will be applied to 3 Click on the A...

Page 184: ...ase from the C Map Database table and click the Remove Selected Database button A prompt appears requesting confirmation of the database removal 2 To proceed with the removal click the Yes button The...

Page 185: ...llation tasks are complete is to perform a soft restart of the VMFT node To restart the VMFT node 1 Navigate to the lower left of the Service screen and click the Start button 2 From the subsequent wi...

Page 186: ...eiving ENC charts and chart updates by CD DVD ENC charts may be installed onto a PC with internet access via the NAVTOR NavSync USB memory stick NavStick Installing the NAVTOR Security Certificate 1 I...

Page 187: ...lication to the hard drive 4 At the Application Install window click the Install button The NavSync application is installed 5 The application checks for updates if updates are available the following...

Page 188: ......

Page 189: ...a ANU A4 Astro 1956 Anguilla ARF ARC 1950 Africa ARS ARC 1960 Africa 1960 adjustment of ARC 1950 datum ASC Ascension Island 1958 ASM Astro 1958 Montserrat ASQ Astronomical Station 1952 Marcus Island A...

Page 190: ...ew Zealand CHU Chua Astro Paraguay COA Corrego Alegre Brazil CRA Cruz Astro 1947 Guadalcanal Solomon Islands CZX DOS 66 CZX6 Santa Cruz DOS 1966 72 DAK Dakar Senegal DCL DCS 3 Astro 1973 adjustment St...

Page 191: ...GRA Graciosa Base SW 1948 GSE Goenoeng Segara P5 1933 Kalimantan E GTA Grand Turk Astro 1943 GUA Guam 1963 HEL Helsinki Kallio Church Finland HER Hermannskogel Austria HIT HITO XVIII Astro Chile Also...

Page 192: ...l International spheroid LUZ Luzon 1911 Philippines MAS Massoua Eritrea Ethiopia MDD Madrid 1853 Spain MER Merchich Morocco MET Mercury Datum Satellite Reference System Only MID Midway Astro 1961 MIN...

Page 193: ...Astro 1967 PLN Pico de la Nieves Gran Canaria Canary Islands POE Port Etienne Mauritania POS New Porto Santo POT Potsdam Germany PRI Principe Sinal Domorro Do Papagaio PRP Provisional South American...

Page 194: ...ve Observatory 1925 Malagasy Rebublic TEC Tete Mozambique TIL Timbalai 1948 datum point Sabah Bessel 1841 TIV Timbalai 1948 datum point Sarawak Brunei Everest TOK Tokyo Japan TOY Tokyo Astronomical Ob...

Page 195: ...lottable and the chart may be regarded as being on either datum UND Undetermined Code UND is used where it cannot be stated with any degree of certainty that positions read from the chart can be relat...

Page 196: ......

Page 197: ...covers the creating editing and deleting of the following navigation tools Parallel Index Lines Clearing Lines Line Of Position Ownship History Parallel Cursor Distance Line Display Settings Man Overb...

Page 198: ...type and which side of the ship the line is on To access PI lines left click on the Parallel Index Lines field from the NAV Tools menu list The PI Lines window includes the following three tab folders...

Page 199: ...nes To create and name a new set of PI lines do the following 1 Click on the Add Set button 2 The screen prompts to enter a name for the new set of PI lines with the current date and time highlighted...

Page 200: ...ick the check box 4 To delete a set select the set name by clicking on the Selected Set drop down list and with the set displayed click on the Delete Set button A window appears prompting to confirm t...

Page 201: ...r Renaming PI Line Sets To copy or rename a PI line set do the following To copy a PI Line set 1 Select the set from the Selected Set drop down list and click on the Copy Set button The window prompts...

Page 202: ...different line style for each PI line may be selected or a line style may be applied to all lines in the set To select a line style for each PI line 1 Click on the drop down list next to the current...

Page 203: ...ge to green editable Move the trackball to change the data values the NM range value denotes the distance of the line to the CCRP defaults to 0 0 and the bearing values denote the angle from 000 To ch...

Page 204: ...To truncate a PI line from the screen 1 Either click on the line s end point hold down the left key and drag the end point to the required position 2 Or to truncate a line at a cursor position move th...

Page 205: ...ated in the Edit tab folder To select a set for display click on the set name the set s check box is ticked and the PI lines are displayed Continue to select line sets for display as required To remov...

Page 206: ...t to export the files to this is usually an external device such as a USB memory stick 3 Enter a filename for the PI lines in the Filename field using the screen keypad 4 Click on the Export button Th...

Page 207: ...nes for monitoring against own ship s course The I O tab enables you to import or export sets of clearing lines to and from an external device such as a USB memory stick Editing Clearing Lines There a...

Page 208: ...ption is highlighted There are two ways to define the geographic origin of a clearing line 1 Move the cursor to the required position on the display the letters ADD are shown below the cursor symbol a...

Page 209: ...c To place the origin at own ship s CCRP select Ownship d To place the origin at a selected location on the chart display select From Chart Move the cursor to the display a is added to the cursor and...

Page 210: ...the left key on the trackball and use the trackball to move the bearing line along the dashed line 3 Release the left key when the required position is displayed To create or edit clearing lines from...

Page 211: ...red text using the on screen keypad 2 To enter a label for each clearing line click in the Label field and enter required text using the on screen keypad The label given will be displayed below the cl...

Page 212: ...hen AUTO Join is enabled the button is highlighted until the feature is disabled by clicking the button again 2 Add the type of clearing line to auto join by clicking the Add Bearing or Add Range butt...

Page 213: ...was opened the title of the set will be displayed with an To save the set with the same name click the Save button 6 To remove a set of clearing lines from the editor click the Clear New button If an...

Page 214: ...ently loaded for monitoring 1 Open the set from the Editor tab The system creates a duplicate set for editing over the monitored set in the editable colour amber 2 Make the required edits to the set A...

Page 215: ...lect All button 3 Navigate to the directory folder on the external device where you want to export the files to 4 Enter a filename for the clearing lines in the Filename field using the screen keypad...

Page 216: ...e and Ignore 4 Select the required action and either click the Apply To Selected button to a selected set or to apply the action to all imported sets click the Save button 5 When an import action is s...

Page 217: ...e shown if both range and bearing are measured to the same object The Line Of Position window is divided into two main areas The upper part LOP Data provides a Enhanced Position Entry control which al...

Page 218: ...cation using the numerical keypad 2 Or right click on the display at the desired LOP reference point and select Add Line of Position LOP in the semi transparent context menu that appears The Line Of P...

Page 219: ...of Position LOPs area of the window and the LOP data on the screen changes to orange 6 Repeat the process above for the required number of LOPs Note that when a LOP has been added to the LOPs list it...

Page 220: ...he same position as the temporary fix symbol The table below shows the temporary and permanent LOP fix symbols together with a brief description Symbol Description The Temporary Fix symbol is created...

Page 221: ...servations VR Position was obtained by making both bearing and range observations Using a LOP Position Sensor A LOP fix may be used as the active data source for the position sensor see Position Value...

Page 222: ...informing the operator that the system is waiting for message data from the OBD Once the input from the OBD has been received the dialogue will close and the Bearing value in the LOP menu will be popu...

Page 223: ...in line Past position dots are displayed on the history tracks spaced at operator selected intervals Event marks may be added at any time to ownship s history track Details of past position dots and e...

Page 224: ...r only will be displayed To change the maximum length click in the field and when the current value changes to green move the trackball to increase or decrease the value click again to accept the sele...

Page 225: ...from the display Position Spacing The spacing of positions controls the gap between the past position dots The minimum is 1 minute and the maximum is 120 minutes To change the position spacing click...

Page 226: ...generate an event click the Add Event button An orange outline box with a diagonal line through it is shown on the history track at the current CCRP position The display of events can be toggled on an...

Page 227: ...either both sides of the CCRP full mode or one side of the CCRP half mode To access the facility click on the Parallel Cursor field from the NAV Tools menu list The Parallel Cursor window is displayed...

Page 228: ...ct to ship s heading When True is selected and the heading becomes invalid the parallel cursor is not displayed 5 To rotate the parallel cursor either click on one of the four semi circular markers ho...

Page 229: ...required Start location on the display and from the semi transparent context menu select Place Distance Line Start 3 Move the cursor to the required end point this may require re scaling and panning...

Page 230: ...se the trackball to move the start or end dot to the required position To fix the position release the left key As the length of the line is increased or decreased the Great Circle NM value read only...

Page 231: ...ed The folder includes the following options Beam Line Length adjustment True Scale Ship own ship display settings including Off Default Symbol Custom Symbol Stern Line Antenna Position Own ship vecto...

Page 232: ...ool The true scale outline may be displayed if the greatest dimension of the ship is larger than 3mm on the display When the Custom Symbol check box is ticked the screen shows ownship drawn to represe...

Page 233: ...tor Tick Marks Tick marks can displayed along the vector length at one minute intervals with every sixth tick mark is shown with double thickness for more details see Own Ship Symbols To turn vector t...

Page 234: ...on Predicted vector is drawn either as a straight line or an arc from own ship s CCRP If own ship is currently turning a radius based on the selected Rate of Turn sensor and the current ground stabili...

Page 235: ...d may not be visible on the display depending on scale and ship speed Predicted ship will be displayed regardless of whether the display setting is in predicted vector predicted path or COG vector Whe...

Page 236: ...chart window The L L grid values are taken from the latest valid position of own ship s CCRP as reported by the Position sensor The L L grid is only displayed when the presentation mode is N UP The g...

Page 237: ...alues Elapsed time counts up while range and bearing values update automatically based on own ship movements MOB symbol will drift from the initial location based on the own ship set and drift at the...

Page 238: ...ing activated based on the suspicion that a person has gone overboard sometime in the past the operator may manually adjust the elapsed time value accordingly by clicking on the Manual Edit button If...

Page 239: ...become editable and additional buttons Done and Cancel Edit appear 2 To edit the MOB position enter values in the relevant fields and click the Done button The MOB symbol is re drawn at the revised l...

Page 240: ...Start button at the bottom of the window active Note that the MOB operation is not active until the Start button is pressed 3 If the MOB event was not started using the top level button the Start but...

Page 241: ...A NAV mark is created at the selected position To view data on the NAV Mark do the following 1 Right click on the NAV Mark and select Query Chart from the semi transparent window The Chart Query windo...

Page 242: ...4012 To delete a NAV Mark do the following 1 Right click on the NAV Mark a semi transparent window appears at the position selected 2 Select the Delete Navigation Mark from the window The NAV Mark is...

Page 243: ...water speed ground speed etc regardless of the node from which the operator makes the selection As an example if the operator selects position from GPS1 on one node GPS1 is selected as the source of p...

Page 244: ...ecific sensor source button Sensor Data Source The name of each available sensor data source is listed The sensor source currently used and its current value are highlighted in bold and the sensor s r...

Page 245: ...depth below keel see Depth Source Values Set and Drift Sensor To change the current sensor source for set and drift see Set and Drift values Rate of Turn Sensor To change the current sensor source for...

Page 246: ...values do the following 1 Tick the button next to the source Whenever the sensor source is about to be changed a window prompts you to confirm the change 2 To confirm click the Yes button or to retur...

Page 247: ...source Whenever the sensor source is about to be changed a window prompts you to confirm the change 2 To confirm click the Yes button or to return to the previous sensor source and value click the No...

Page 248: ...he data source where the update should not apply To cancel all changes and revert to the previous sensor source click the Cancel button 4 Where the sensor is changed the values shown against the selec...

Page 249: ...Manual data cannot be entered for COG if AIS input is enabled Before entering data turn off the AIS input see AIS display 1 To enter manual sensor data click in the MAN field the text changes to gree...

Page 250: ...ased on dead reckoning DR from the last valid position received If position data becomes invalid the system will automatically switch to water stabilised mode Dead Reckoning values If valid position d...

Page 251: ...data is available Manual data cannot be entered if AIS input is enabled Before entering data turn off the AIS input see AIS Display in Chapter 10 Targets 1 To enter manual sensor data click in the MA...

Page 252: ...circle symbol will be displayed in yellowish orange while manual position data is being used Position Offset The Position Offset area shows the currently selected sensor and enables the operator to en...

Page 253: ...ship tick the Offset Applied check box Offset values are not applied to the chart until this check box is ticked When offset values are applied the entry is highlighted in the Posn popup window with...

Page 254: ...o confirm click the Yes button or to return to the previous sensor source and value click the No button If no sensor source is currently available the user can enter manual sensor data CAUTION MANUAL...

Page 255: ...lly via an interface The ROT is indicated as unavailable if the Heading from the selected source is unavailable or invalid Date and Time The Date and Time folder shows the system date and time with th...

Page 256: ......

Page 257: ...immediate attention or user action 2 Warnings indicate changed conditions requiring attention for reasons of precaution which are not immediately hazardous but may become so if no decision or action i...

Page 258: ...st of Alarms Warnings and Cautions Prompts Prompts appear directly underneath the Alerts field A Prompts window listing permanent and temporary prompts when they appear may be accessed either by click...

Page 259: ...sh orange for warnings Alarms and Warnings need to be acknowledged in one of two ways 1 Either by clicking on the message in the Alert Status Indicator Or 2 by clicking on the ACK ALARM button on the...

Page 260: ...priority or a more recent alert of the same priority If the internal buzzer is enabled the buzzer will only sound when there are unacknowledged alarms or warnings Acknowledged Alerts If an alert has b...

Page 261: ...You can acknowledge alerts either by clicking on the selected alert in the list or by clicking on the ACK ALARM button on the control panel The alerts list will change indication as follows An unackn...

Page 262: ...all acknowledged alerts untick the Hide Acknowledged check box Sort by Group To arrange alerts into groups tick the Sort by Group check box Grouping reduces the type and number of alerts displayed by...

Page 263: ...arily muted by clicking on the icon to the right of the Alert Status Indicator When the buzzer is muted a white diagonal line appears through the icon To re enable the buzzer click on the icon again t...

Page 264: ...to a user interaction and are displayed briefly for a commissioned time period usually around 5 seconds When a temporary prompt is active a pale coloured background field appears below the permanent...

Page 265: ...e alarm buzzer for an unlimited period of time tick the Mute length unlimited check box The Mute Length field displays Unlimited as read only If the mute length is set higher than the default time or...

Page 266: ...ings and cautions Sensor data types that have been selected for primary navigation in the CCRS Alert Reporter of the Configuration tool and are currently selected for navigation will always generate a...

Page 267: ...Ownship position is being dead reckoned datum is invalid or Ownship heading is unusable Warning AIS Full The number of AIS targets exceeds system capacity AIS targets that are furthest away will not b...

Page 268: ...ystem detects ARCS Skipper permits installed Only ARCS Navigator permits are supported for operation with ARCS RNC charts Warning Arrival Time Not Achievable System cannot generate speed orders for sh...

Page 269: ...cell has expired This cell may be out of date and MUST NOT be used for Primary NAVIGATION Warning Chart Permissions Chart subscription service has expired Warning Chart Permissions Expiring Chart subs...

Page 270: ...CPA Limit Target has infringed CPA TCPA limits Alarm Critical Point Abeam Ship is abeam a Critical Point Alarm or Warning Depending on configuration Critical Point Approach Critical Point is now withi...

Page 271: ...p of changes recommended Warning Database Synchronization Database at this node is synchronizing to the system database Synchronization must complete before making changes to any database items includ...

Page 272: ...Integrity VisionMaster FT Alarm or Caution Depending on configuration Distribution Service Error Distribution service is not running Warning Docking Speeds Unusable Sensor Speed And Distance Integrity...

Page 273: ...ing Dangers An error finding dangers on the chart has been detected Warning Excessive Turn Rate Required Difference limit between required turn rate and planned turn rate exceeded Warning Exit Criteri...

Page 274: ...Unavailable I O Device Unavailable Warning Inaccurate Chart Positions on this chart are inaccurate because this chart does not provide a mapping to standard WGS 84 coordinates Warning Internal Error...

Page 275: ...isionMaster FT Alarm or Caution Depending on configuration Magnetic Heading Unusable Sensor Magnetic Heading Integrity VisionMaster FT Alarm or Warning Magnetic Sensor Heading Unusable Sensor Magnetic...

Page 276: ...y Region A low value for look ahead time or distance has resulted in a small safety region for detecting chart dangers on own ship s course This may not provide adequate time to take action if a dange...

Page 277: ...ter FT Warning Position Unusable Sensor Position Integrity VisionMaster FT Alarm or Warning Depending on configuration Predicted Path Mismatch Target vectors and own ship vectors are water stabilized...

Page 278: ...Caution Depending on configuration Route Leg Skipped The ship has skipped one or more legs of the route plan Warning Route Monitoring Stopped Route Monitoring Stopped Alarm Rudder Angle Unusable Senso...

Page 279: ...Stern Ground Speed Integrity VisionMaster FT Alarm or Caution Depending on configuration System Tracks Almost Full Tracking 95 of the system maximum number of targets Caution System Tracks Full Tracki...

Page 280: ...h True Direction Unusable Sensor True Wind With True Direction Integrity VisionMaster FT Alarm or Caution Depending on configuration Turn Radius Modified The ordered turn radius has been automatically...

Page 281: ...ween waypoints on a monitored route see ETA Calculator Specify the speed for a current leg and future legs on a monitored route see Route ETA Specify an arrival time on a monitored route the system th...

Page 282: ...Routes ECDIS E User Guide 8 2 65934012 You can access Route sub menus in one of two ways 1 Either click on Routes from the Main Menu list Or 2 Click on the Route field in the upper toolbar...

Page 283: ...have been created on another ship s VisionMaster FT system and copied using the file Import Export function External Routes These are routes created by and stored at an external device which can then...

Page 284: ...h only one route may be monitored The same route monitoring information and monitored track is displayed on all nodes regardless of which node the operator began monitoring Unlike a monitored route a...

Page 285: ...itially available when adding waypoints Add Waypoint or Add Waypoint to Beginning If the waypoint to be added is the first in the route then either waypoint option can be selected You can select to an...

Page 286: ...ach waypoint When three or more waypoints are created the system displays the turn radius at each waypoint except first and last using the system default radius or a radius value modified by the user...

Page 287: ...point and its wheelover are automatically numbered depending on their position on the route e g if the waypoint is created on the leg between waypoints W3 and W4 then the new waypoint becomes W4 and a...

Page 288: ...older see Edit Route When the turn is created its turn radius is set to either the previous turn s radius or if this is the first turn it is set to the default radius To change a turn radius do the fo...

Page 289: ...all the route s attributes waypoint leg and turn data to be edited The CPs tab folder allows the operator to insert alerts in the form of alarms and warnings along a route The Dngrs tab folder lists o...

Page 290: ...e button displays No Errors in the system background colour If the route s attributes do contain errors the route cannot be validated and the button changes to display Errors with a yellow background...

Page 291: ...screen keypad and click on the keypad OK button 3 The route name is entered the current time date is listed in the Open Route window and a temporary prompt appears confirming that the route plan has b...

Page 292: ...h the selected route displayed click on the Clear New button 2 If unsaved changes have been made to the route a Close Confirmation window appears prompting to Save Don t Save or Cancel the closure 3 S...

Page 293: ...reversed route 4 To save the reversed route click on the Save As button and enter a name using the screen keypad Total Distance and Duration The Total Distance and Duration area calculates the total...

Page 294: ...of deviation from the planned route at which the off track alert occurs The settings in the Route tab will apply to all legs and turns on a route Different XTD limits for individual legs and turns ma...

Page 295: ...te being edited The folder is divided into the following areas Route Waypoint Approaching Leg Turn Departing Leg Route The Route area enables the currently monitored route to be saved and validated Wh...

Page 296: ...gate to the location in the route where you want the new waypoint created and left click on either the previous waypoint or the next waypoint and then click the New button The system creates a new way...

Page 297: ...aypoint Click OK on the Chart Query window to fix the waypoint at the chart object position c To place the waypoint at own ship s CCRP select Ownship d To place the waypoint at a selected location on...

Page 298: ...aximum turn radius is 10 NM Speed speed of turn the maximum speed is 99 kn XTD Limits the cross track distance in metres that the ship can stray from the route turn track line before an off track erro...

Page 299: ...le of the leg in true degrees To edit the Departing Leg data do the following 1 To change the leg speed or XTD limit click in the relevant field the text changes to green editable Move the trackball l...

Page 300: ...mber of leg and turn segments on the route the number being dependant on the number of waypoints on the route If the List Cautions check box is ticked the directory tree will also include cautions rel...

Page 301: ...ble on Chart Radar nodes Highlight NAV Hazards not available on Chart Radar nodes List Cautions Display Safety Regions The Dangers tab folder also includes the option of displaying the route safety re...

Page 302: ...The Safety Contour setting turns the display of route safety contour on and off The NAV Hazards setting turns the display of route navigational hazards on and off The figure below shows a route with...

Page 303: ...r a description of the Save and Error functions see Edit Route Route Tab Critical Point To generate critical points on a previously saved route open the route from the Route tab of the Edit Route sub...

Page 304: ...k the button To change a CP s position do one of the following 1 Move the cursor over the CP hold down the left button and move the trackball The CP can be moved either up and down the length of the r...

Page 305: ...lace The CP alert trigger defaults to distance with the trigger being the proximity of own ship to a CP shown in metres When own ship s proximity to a CP is less than the distance shown an alert is ra...

Page 306: ...a new waypoint to the end of the route Insert inserts a new waypoint between two existing waypoints Delete deletes the selected waypoint from the route and redraws the route Reset resets selected way...

Page 307: ...Speed Waypoint Data on Route Editor Table The following waypoint data can be edited on the route editor table Label the name given to the waypoint WPT1 etc Latitude Longitude L L values Turn rate the...

Page 308: ...h leg Leg Time the estimated time for leg traversal in days hours and minutes Editing Data on the Route Editor Table To edit route data in the route editor table do the following To change the waypoin...

Page 309: ...ffset from the current position To change the turn waypoint data or speed and XTD leg data 1 Click in the required field the text changes to green editable 2 Move the trackball left or right to decrea...

Page 310: ...route must be initially saved and validated in the Edit Route sub menu The Monitor Route sub menu contains the following tab folders Route displays read only data monitoring own ship s progress agains...

Page 311: ...ria then route monitoring will stop When a route is loaded for monitoring monitoring automatically starts on the leg closest to the ship that is within the bearing criteria If none of the route s legs...

Page 312: ...om the monitored route at which an alarm is generated Port and Starboard may have different limit values Leg Turn Leg Bearing The bearing of the currently monitored route leg Leg DWOL Distance to next...

Page 313: ...or future legs ETA Estimated Time of Arrival at the end of the route using own ship SOG for this leg and planned speeds for future legs Time Zone Time zone UTC if Local time is selected the local offs...

Page 314: ...d of 30 seconds if the wheelover notifications are not acknowledged Course Difference Limit The maximum bearing angle that own ship may move from the route track defaults to 25 0 If this value is exce...

Page 315: ...e route and its data are removed from the screen and Monitor Route tab folder Course Change Messages Alerts for course changes appear as Operator Messages above the Show Menu button while a route is b...

Page 316: ...ing the system creates a duplicate route with the edit route mode superimposed over the monitored route in the editable colour pink 3 Make the required edits to the route for details refer to Edit Rou...

Page 317: ...icked the Leg or Turn at the specific area where ownship is on the monitored route expands Any dangers and cautions related to that segment can be accessed from the navigation tree The Dangers informa...

Page 318: ...as been changed from the default see Edit Route Critical Points CPs are shown as squares in Monitor mode When CPs are selected from the tab folder the screen symbol changes from a square to a rounded...

Page 319: ...d minutes to travel to the end of the monitored route ETA represents the ETA date and time of own ship at end of the monitored route If the ETA Calculator is opened when there is not a monitored route...

Page 320: ...lue click to the left of the value a numerical keypad appears below the field Enter in the required time values using the keypad and click OK when complete When the Time value is changed the Speed and...

Page 321: ...hing and departing legs for each waypoint on the route To change Route ETA settings do the following 1 Manual speed defaults to 0 0 kn To enter a speed for the present leg or future legs select the Ma...

Page 322: ...ETA field iii To move the date or time back click on the Down arrow to move the date or time forward click on the Up arrow To move the highlight back or forward e g from Month to Year click on the si...

Page 323: ...ly monitored Route Progress The state of ship on the route e g Sailing To WPT6 6 7 denotes next waypoint on route and total number of waypoints XTD XTD Cross Track Distance is the off track distance o...

Page 324: ...wing 1 Select Temp Route from the Route menu and click on the Create Edit button A short straight segment starting at the bow of the ship and in the direction of the ship s COG is drawn The segment is...

Page 325: ...ute is invalid a temporary prompt appears validation errors must be repaired in Create Edit mode before monitoring To monitor a temp route do the following 1 With a temp route created and validated cl...

Page 326: ...route as described above In Temp Route mode move the cursor to the monitored route the letters under the cursor change from TMP WYPT to ADD RTP 3 Click on any point on the monitored route The system c...

Page 327: ...e external drive containing the route or routes to be imported is a USB memory stick connect the device to a USB port on the Trackball 2 From the Route Import Export window click the Import tab A navi...

Page 328: ...re displayed 3 Select one or more routes for export by ticking the check boxes Or to export all routes click the Select All button 4 The navigation tree below the Format field enables you to navigate...

Page 329: ...over lines are drawn Parallel to next leg the wheelover line is drawn parallel to the next leg on the route Perpendicular to leg the wheelover line is drawn at right angles to the route leg that appro...

Page 330: ......

Page 331: ...s Selected Target which includes Target Data and AIS Info Multiple Targets Target Display AIS Display Classes and Types of AIS Activation Zones Own Ship AIS Limits and Settings The following Target su...

Page 332: ...The target processing capacity for rendering AIS targets and other AIS Nav symbols such as ATON SAR and Base Station at any one time is 240 If the number of AIS targets and AIS NAV symbols is near th...

Page 333: ...to sleeping provided the target is not infringing CPA TCPA or BCR BCT alarm criteria or designated a target of interest by virtue of being selected for display in a target tote or is currently in an a...

Page 334: ...selected a dashed square outline appears centred on the target origin and information on the target is shown in the AIS window When an activated AIS target s length and beam exceed the standard AIS s...

Page 335: ...arget to become activated When manually selected by the operator see below When the target infringes the CPA TCPA limits or bow crossing criteria shown on the Target Data tab folder of the Selected Ta...

Page 336: ...set to sleeping with one command from the AIS Display window see Set All AIS Targets to Sleeping in AIS Display AIS Target Alert States The following alert states apply to any AIS target with the exc...

Page 337: ...mits no longer apply AIS Safety Messages Safety messages can be sent from own ship to selected AIS targets The safety message is sent using an AIS minimum Keyboard Display MKD which can be accessed by...

Page 338: ...es All passenger vessels engaged on international voyages Upwards of 500 gross tonnage not engaged on international voyages Class B Class B is intended for non SOLAS commercial and recreational vessel...

Page 339: ...ransmits a message giving position and ID Transmission will be picked up by own ship and also by other AIS equipped vessels within range EPIRB Emergency Position Indicating Radio Beacon is used to ale...

Page 340: ...utomatically cleared if the target ceases to report itself as lost The Lost Target alert automatically clears when there are no lost targets CPA TCPA and BCR BCT Infringement Conditions The conditions...

Page 341: ...selected in Target Display Target Data The Target Data tab folder shows the following tracking data on a selected target Target identification number and name if assigned Range the distance of the tar...

Page 342: ...s own ship s bow then both fields are shown as dashed If a target is lost or if a valid heading or speed for own ship is not available then any invalid target data except the target number name and it...

Page 343: ...target vessel if known Class A or B targets prioritised in order of importance for a description see Classes and Types of AIS Vessel MMSI Source Direct when the target is transmitted by a sending vess...

Page 344: ...data is available then Missing Unknown or Not Available is displayed Draught maximum draught of vessel in metres Haz Cargo information on any hazardous materials the vessel may be carrying Destinatio...

Page 345: ...than dynamic information AIS Safety Messages The AIS Info tab includes the ability to send safety related messages from own ship to a selected AIS vessel Safety messages that have been sent from own...

Page 346: ...ear a message press the Clear button to cancel the send action press Cancel 7 When you have compiled a message click the OK button the MKD is removed from the screen to return the MKD click in the mes...

Page 347: ...with negative CPA TCPA values are excluded from the sorted list The targets in the Range tab folder are sorted on the target range from own ship The User tab folder lists the AIS targets activated an...

Page 348: ...m the list if they are dropped or cancelled by the operator To remove a target from the User list right click on the target ID and select Remove from the window fly out To remove all targets from the...

Page 349: ...the viewing of all targets on the display Tick the check box to view all targets default or untick to remove the targets from the display Identification The target identification is displayed adjacen...

Page 350: ...imeout check box should be ticked to ensure that the vector True Relative setting matches the Trails mode after the vector timeout of 30 seconds see Vector Modes If the check box is not ticked and the...

Page 351: ...ed and the time interval selected To turn past position dots on tick the Display Past Positions check box A thin dotted line connecting the target and its associated dots may be selected to be drawn T...

Page 352: ...NM auto drop 1 To enable Auto Drop tick the Enable check box 2 To change the auto drop range click in the Range field and move the trackball left to decrease or right to increase WARNING IT IS IMPORTA...

Page 353: ...x AIS Input can only be enabled when valid sensor data is being transmitted Activate on CPA TCPA BCR When this check box is enabled default mode a sleeping AIS target is automatically activated when t...

Page 354: ...Navigation objects Virtual ATON will display virtual AtoNs with GPS co ordinates Base Station will display Base Station objects SAR Aircraft will display Search and Rescue Aircraft AIS SART will disp...

Page 355: ...ar blue on the chart display when the symbol is in the on position See the table below Physical ATON Virtual ATON SAR Aircraft SAR Vessel Only when Active AIS SART MOB and EPIRB Base Station Off Missi...

Page 356: ...he purpose of the ATON Symbol and will appear if available immediately above it Racon ATON Emergency Wreck Mark ATON North Cardinal Mark ATON East Cardinal Mark ATON South Cardinal Mark ATON West Card...

Page 357: ...ick of that particular target Relevant information about this target is displayed in a Selected Target window Within this window Nav Status displays as either Active or Test depending on whether in ac...

Page 358: ...the following criteria On a two node system all AIS targets are set to sleeping on the node that the command was made The same AIS targets that may be activated on another node will not be set to sle...

Page 359: ...meters are shown on the display as a solid green line When an activation zone is being edited its line colour changes from green to light purple Any targets found in an activation zone are marked by a...

Page 360: ...utton of the annular zone to be edited Zone 1 or Zone 2 You can edit both the Bearing the radial angle of the zone and the Range the depth of the zone To edit the zone bearing 1 Click inside the Start...

Page 361: ...on zone is a randomly shaped zone constructed from operator defined zone points maximum of 10 which are entered directly on to the chart display Polygonal lines may be drawn up to a maximum distance o...

Page 362: ...e Edit Off button of the polygonal zone to be edited the button changes to Submit In edit mode all activation zones are displayed on the screen with the zone to be edited shown in purple edit mode wit...

Page 363: ...Name of vessel Class A or B Vessel MMSI Own Ship tab folder also includes the following tabs Dynamic Voyage Static All Own Ship AIS features shown in the tab folders will display read only data if th...

Page 364: ...calculator for information on using the ETA calculator refer to ETA Calculator in the Routes menu Date Time UTC or Local All Voyage settings apart from Cargo are editable if AIS MKD Control is enabled...

Page 365: ...the time the message was sent and the full message content The following function buttons are included at the bottom of the tab folder Send Addressed Message Send Broadcast Message Safety messages ca...

Page 366: ...sent message will change the Send Addressed Message button to Send Additional Massage When a message sent to a specific vessel is selected from the Sent messages list the following additional function...

Page 367: ...received the Message icon is displayed in amber an audible indicator is given and the message is shown in the Messages Rx tab Left click to view information on the message The MMSI number of the vess...

Page 368: ...there are no targets infringing the defined limits To change the infringement limits do the following 1 Click inside the field to be changed The value changes from white to green editable 2 Move the t...

Page 369: ...Target Association Parameter Distance Angle Speed Standard Setting 0 06 NM 1 0 5 0 kn Loose Setting 0 18 NM 2 0 5 0 kn Range of values 0 01 NM to 0 18 NM 0 1 to 3 6 1 5 kn to 10 kn If target associati...

Page 370: ...t CPA TCPA data This same data is used when evaluating whether a target is infringing the operator selected CPA TCPA bow crossing and target association limits The VisionMaster system is designed in s...

Page 371: ...tween objects they are shown as a dashed orange line VRMs display a range ring indicated by long orange dashes and is centred on the previously created EBL The first and second EBL and VRM have differ...

Page 372: ...y control on the control panel to switch on EBL1 If no bearing value has been previously entered EBL 1 defaults to 5 0 o starboard of ship s heading and EBL 2 defaults to 355 o starboard The EBL 1 and...

Page 373: ...he left key to accept To change the bearing from the readout 1 Left click in the EBL readout field The readout text becomes editable green 2 Move the trackball left or right until the required readout...

Page 374: ...VRM rotary control will automatically switch on VRM1 If VRM1 is switched off but VRM2 is on then turning the rotary control will adjust the VRM2 range To change both the ERBL range and bearing 1 Move...

Page 375: ...ge and bearing to the end point update every second Drop End Point is only allowed when the ERBL origin is centred After Offset Origin or Drop Origin has been applied the following option becomes avai...

Page 376: ...sor is positioned over the ERBL origin it changes to a bidirectional arrow 2 To move the ERBL Left click and hold on the origin Use trackball to move the ERBL to required location release to drop it T...

Page 377: ...e following 1 Left click VRM button This becomes highlighted and the range value entered is displayed The VRM is shown as a dashed circle centred on the CCRP The size of the circle is shown by the VRM...

Page 378: ......

Page 379: ...functions Day Night Modes Brilliance Groups Chart Symbols Brilliance Check You can access the Brilliance sub menus in one of two ways Click on the Brilliance button in the main menu list to display t...

Page 380: ...setting the screen colours change relevant to the day dusk or night mode selected Alternatively click on the Up Down BRILL buttons on the Control Panel to brighten or darken the colour setting If the...

Page 381: ...eft click to make control bar active The bar colour will appear blue 3 Move the trackball left or right to move the bar to the level required 4 Left click to set the level and de activate the bar adju...

Page 382: ...tour and other objects to be adequately displayed 1 To adjust click on the Color Diagram button a window appears over the screen with 20 different background colour options and a coloured diagonal lin...

Page 383: ...observe the grey box in the centre of the window If the box is not visible increase the brightness by touching the symbol until it can be just distinguished in the window or If the box is clearly visi...

Page 384: ......

Page 385: ...eading position route and steering status wind data etc The data presented on a CID page varies depending on the purpose of that page The customising of all CID pages both side panel and popup pages a...

Page 386: ...lowing data True heading data the current bearing value as shown in the HDG data display see Sensor Data Display and the data source of the value e g Gyro A graphical display below the HDG also shows...

Page 387: ...urn in degrees per minute as shown in the ROT folder see Rate of Turn Values A graphical display below the ROT also shows the degrees per minute value Course and Speed data including STW SOG COG value...

Page 388: ...under a HUD widget are selectable without moving the widget The following HUD widgets are available from the CID button as default True Wind displays true wind angle the true wind angle readout and t...

Page 389: ...irectional arrow indicator 3 Hold down the left key and use the trackball to move the object around the chart display The opacity of the HUD widgets may be changed from the default of 60 To change the...

Page 390: ...show a series of short red dashes Default CID Page The default CID page will always be available on an ECDIS E The default page includes the following CID elements displaying real time data for ownshi...

Page 391: ...while the bearing tick marks and COG values move as COG bearing changes Speed Over Ground SOG Bow P S the bow transverse SOG from port to starboard CCRP P S the consistent common reference point trans...

Page 392: ...e destination waypoint of the current leg Cross Track Distance the distance own ship is off track from route L left of track R right of track displayed as both horizontal bar graph and distance value...

Page 393: ...t Wind True see Environment Set and Drift Depth Below Keel see Environment Pitch and Roll Bow and Starboard including the following graphic elements the current pitch angle as reported by the selected...

Page 394: ......

Page 395: ...ECDIS E User Guide System 65934012 13 1 Chapter 13 System The System menu provides access to the following system functions User Profiles Options Diagnostics Commissioning Time Management Shutdown...

Page 396: ...cessed by left clicking on the Profiles button in the lower toolbar area and selecting Edit Create Profile Previously created and saved profiles can be selected in the Available Profiles selection dro...

Page 397: ...g Chart Dangers Look Ahead Type Look Ahead Time Look ahead Distance Proximity Buffer Size Added Breadth Alarm on Chart Cautions Charting Common Chart Depths Height menu Safety Depth Deep Contour Shall...

Page 398: ...file field The screen keypad appears 2 Enter a profile name use the trackball to navigate to the relevant alpha numeric keys and left click When a profile name has been entered click the OK button on...

Page 399: ...ted and saved profiles A temporary prompt appears confirming that the profile has been applied 2 From the User Profiles menu a Select a previously created user profile from the Available Profiles drop...

Page 400: ...stments to be made Chart Settings enables Other as shown in the Other display mode of Chart Settings or Standard as shown in the Standard display mode of Chart Settings to be selected Charting Common...

Page 401: ...features in the Selection list click the Select All button or to deselect all the features including the selected profile settings click the Deselect All button 3 Click the Save button to confirm sele...

Page 402: ...button The settings are saved and the menu returns with the edited profile highlighted in the Available Profiles list 5 To cancel any profile setting changes click the Cancel button ARCS The off scree...

Page 403: ...ys a selection of common units which are displayed when the system is running e g meters knots degrees etc The Options window displays the units as read only information unless the commissioning engin...

Page 404: ...urrently selected data source as shown on the Sensor Data Display Connection Status displays the connection status of all nodes on a multi node system Buzzer enables the Alarm buzzer to be tested The...

Page 405: ...will generate a smaller report than verbose making it easier to transfer over slow internet connections Verbose this default option contains the same information as the concise report however more det...

Page 406: ...are on the device they will be listed in the window below the device navigation tree as rpt files 3 To change the file name from the default of Report date click in the Filename field and using the on...

Page 407: ...in the Description field 4 Click on the Export button An Action Required window appears listing all the available diagnostic log files 5 Either select individual files by ticking their check boxes or...

Page 408: ...on an event driven basis Routes Information Announcements Information A copy of the configuration file is logged to the database on Node start up On subsequent startups a copy of the configuration fil...

Page 409: ...emory stick To export a datalog file do the following 1 Insert an external device such as a memory stick into the VisionMaster PC and click on the DataLog tab folder 2 Select the log type to be export...

Page 410: ...used to receive data from other sensors in addition to a data type then these sensors will also be shown in the table For example one Interface may be used to receive COG SOG Depth and Wind sensor da...

Page 411: ...owledged Faults any unacknowledged faults on the sensor data e g Uncompensated Unaligned etc See Description of Sensor Data States for a description of all fault conditions Acknowledge button Ack whic...

Page 412: ...degraded Invalid The sensor providing the data is indicating that the data is not valid When this applies the data is considered unusable Manual The data was manually entered When this applies the dat...

Page 413: ...common reference point CCRP for the ship This adjustment is often referred to as a lever arm correction This is easiest to understand as it applies to position data When the system receives position d...

Page 414: ...t to the node is displayed in yellowish orange When the node is switched on or reconnected its status bar changes to green CAUTION The table shows the node connection status from the point of view of...

Page 415: ...elating to own ship that has been entered in system configuration Service displays Communications and PCIO service information on the system When a user has logged in by entering a user name and passw...

Page 416: ...ys the number of nodes on the system 1 or 2 Unauthorized System If the system is not authorized the tab folder states that the system is unauthorized and will revert to a degraded state of functionali...

Page 417: ...led operate in a state of degraded functionality after the 7 day period expires Config Update The Config Update feature enables the operator to export a copy of their system configuration to an extern...

Page 418: ...in order to bypass common email filters Importing a Configuration To import a configuration do the following 1 Connect a USB memory stick to the USB connector on the trackball The device name appears...

Page 419: ...mporting a modified configuration the system will automatically revert to the previous configuration at the next re start Characteristics The Characteristics tab folder displays persistent static data...

Page 420: ...an then be saved to an external device Available for display to a non logged on user Port Monitor 1 To view Port Monitor data click on the Communications button highlight Port Monitor in the tree menu...

Page 421: ...and click in the Binary button to view data as binary code 4 With all required settings made click on the Start button The Port Monitor window displays real time received and sent data for the select...

Page 422: ...ab folder The Port Logging window is displayed which can be moved and scaled to suit 2 Click the radio button as appropriate for the data used on that port The options are data sent from the port to t...

Page 423: ...splayed in the lower popup toolbar Local Offset enables the input of a local time offset from GMT in either an East direction offset before GMT or a West direction offset after GMT Time Sync Source sh...

Page 424: ...their particular node on the system for a prolonged period of time Other nodes on the system will not be affected Restart All Systems is selected if for whatever reason the operator requires to restar...

Page 425: ......

Reviews: