


22
Utility Menu Screens
6
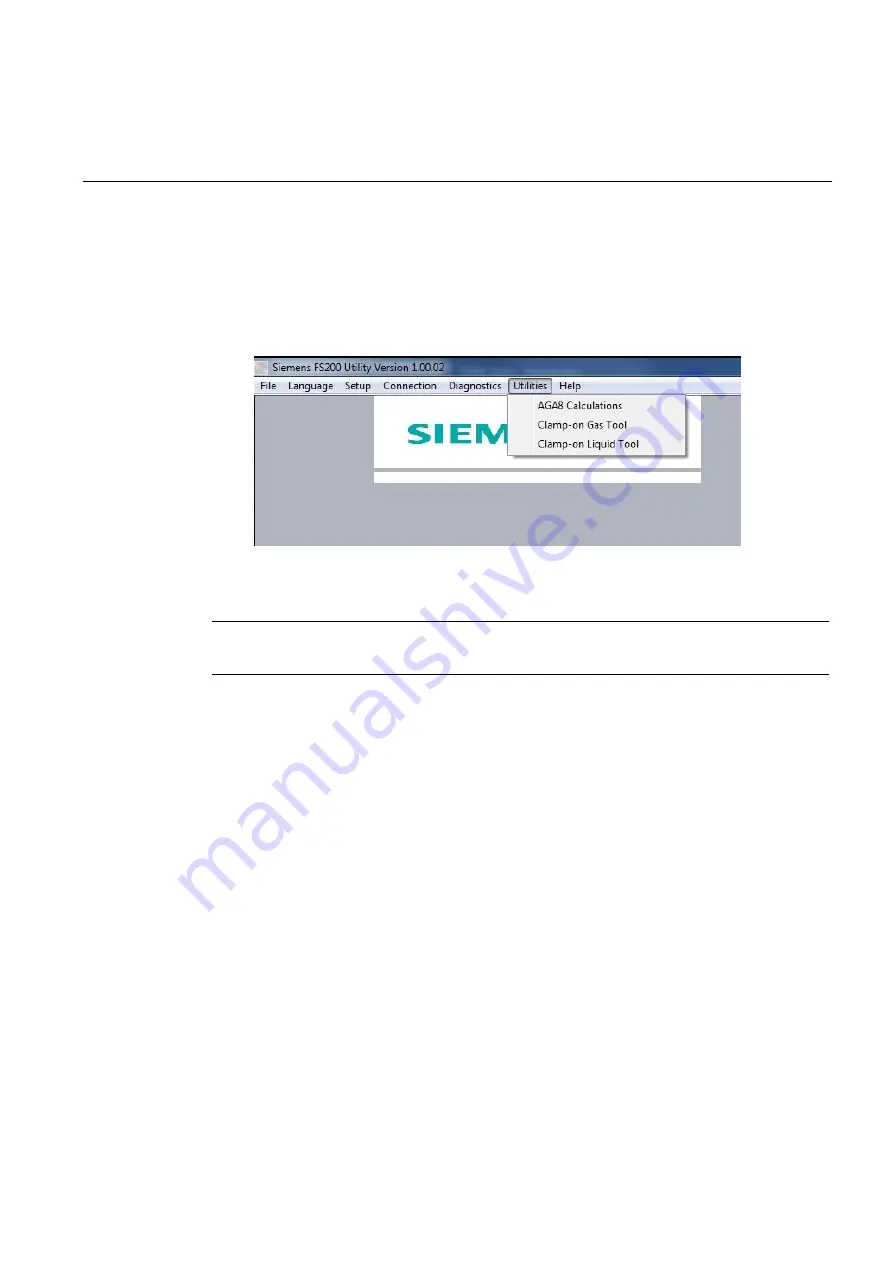
Utilities Menu
The Utilities menu has three sub-menus:
● AGA8 Calculations
● Clamp-On Gas Tool
● Clamp-On Liquid Tool
Figure 6.1 Utility Menu Options
6.1 AGA8 Calculations
Note
AGA8 tables are used with gas flowmeters only.
The [AGA8 Calculations] screen is used to generate AGA8 data values. It will enable the
entry of gas composition mole fractions, along with base and actual temperature and
pressure, to determine fundamental gas values such as theoretical speed of sound (VoS),
Mass, and Enthalpy.
Additionally, the AGA-8 Utility can be used to compute an AGA-8 table for fixed composition
gasses that can be uploaded to the flowmeter directly. This table will enable the meter to
perform standard volume correction based on measured temperature and pressure of your
gas application.
Entering Fundamental Gas fractions
1. Click the AGA8 calculation parameter in the Utilities drop-down menu.
2. Refer to Figure 6-2 below. Input your default units of measurement in the row at the top
of the screen.
3. Enter your gas composition mole fractions taken from a recent Gas Chromatograph
report into the appropriate screen fields.
4. Click the [Normalize] button to ensure the total percental equal 100%.
5. Enter your base pressure, actual pressure, base temperature and actual temperature.
6. Click [Calculate] to generate the screen.
FS2
0
0 Programming Manual, 03/2020,
A5E02951525-AB