background image


24 


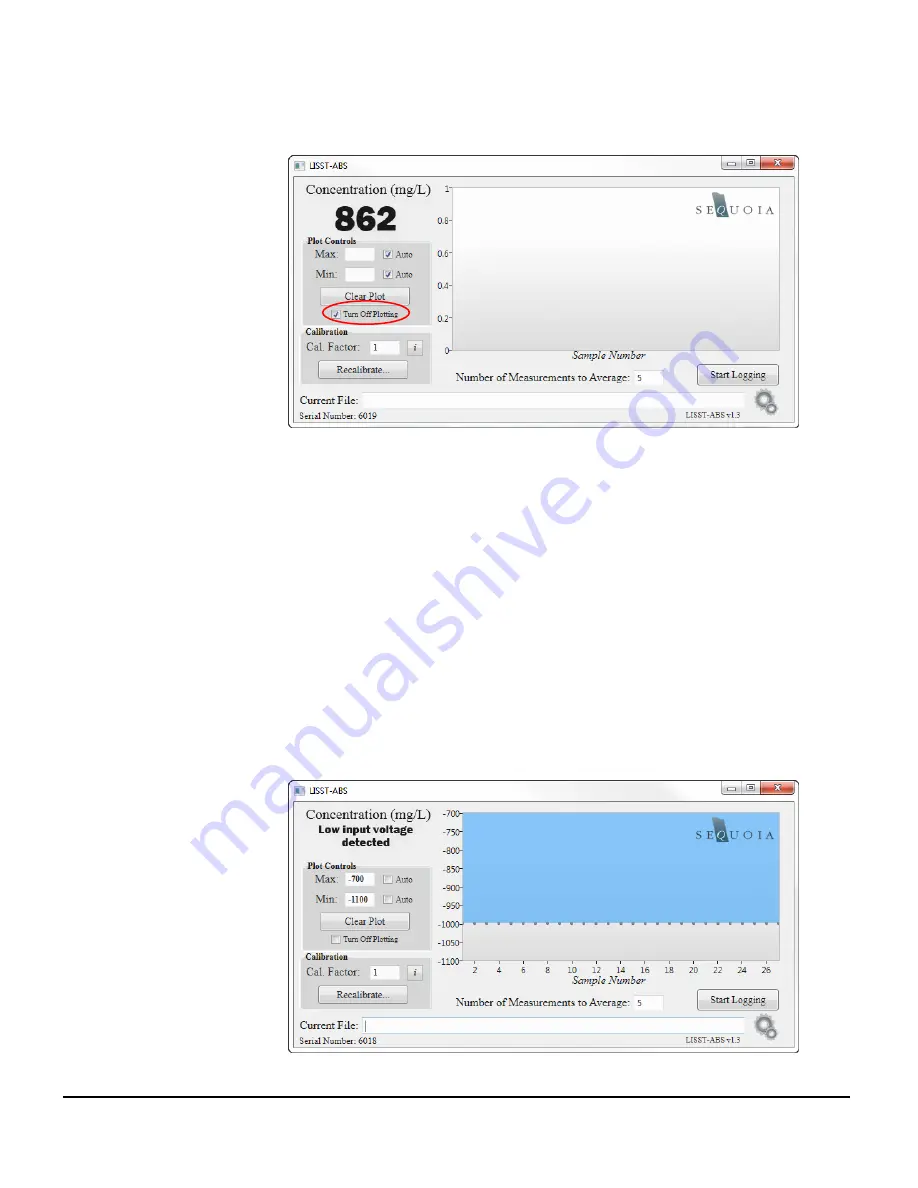
generating  a  plot  that  will  not  be  viewed.  To  resume  plotting 
data, simply uncheck the box.  


Errors/Disconnection 

Should  there  be  a  power  interruption  or  momentary 
disconnection,  the  LISST-ABS  software  will  automatically 
reconnect when the power or connection is reestablished. If the 
disconnection occurs while logging data, the logging will pause 
and resume automatically when the instrument is reconnected.  

Should one of the two error codes be produced by the ABS,  a 
brief description of the problem will be shown.   A value of -999 
means  low  power  supply  voltage  and  the  instrument  cannot 
operate.  A  value  of  -888  implies  obstruction  within  sample 
volume,  or  the  second  sample  volume  is  at  a  boundary  (see 
Appendix  C).  In  either  case,  this  error  is  triggered  when 
backscatter from the second range cell is stronger than the first. 


Summary of Contents for LISST-ABS

Page 1: ...c Backscatter Sensor User s Manual Version 1 4 February 2017 Sequoia Scientific Inc 2700 Richards Road Suite 107 Bellevue WA 98005 USA Phone 1 425 641 0944 Fax 1 425 643 0595 support SequoiaSci com ww...

Page 2: ......

Page 3: ...nt was purchased directly from Sequoia Please be sure to include the instrument serial number with any correspondence A list of local Sequoia distributors can be found at our website http www sequoias...

Page 4: ...32 OUTPUT OPERATIONS 10 2 4 ANALOG OUTPUT OPERATIONS 15 2 5 USB OPERATIONS VIA PC SOFTWARE 17 2 6 FIELD DEPLOYMENT SUGGESTIONS 27 APPENDIX A LISST ABS CABLE WIRING AND CONNECTOR PINOUTS 28 APPENDIX B...

Page 5: ...d is a credit card style USB memory card with software installation files The sensor head is covered with a protective red cap to prevent accidental impact and damage of the acoustic transceiver white...

Page 6: ...sample variability by averaging Type the desired number of measurements to average in the box below the plot If you enter 5 for example each point on the plot will show the average of 5 samples and t...

Page 7: ...is updated For more detailed understanding of the technology please see Appendix C The LISST ABS can output the Uncalibrated Concentration using three different methods SDI 12 RS232 and analog output...

Page 8: ...ions designed specifically for different connection requirements For example we provide a termination with only the three individual wires that are labeled and can be easily connected to the datalogge...

Page 9: ...aMC3 aM4 aMC4 Start a measurement returns number of seconds till sample is ready to be read Sends service request when measurement is complete An M command returns a single 1 second average M1 M2 M3...

Page 10: ...Ab Change Address Syntax aAb Description Change address of sensor at address a to b Example Command 0A3 request sensor at address 0 to change to address 3 Response 3 responds with new address of senso...

Page 11: ...ds address to confirm measurement is ready to be read aC Start Concurrent Measurement Syntax aC Description Start a measurement returns number of seconds till sample is ready to be read Does not send...

Page 12: ...ommand is below Example Command 3R request continuous measurement Response 3 responds with address of sensor aV Start Verification Syntax aV Description Not supported but the sensor will respond to th...

Page 13: ...ative measurements an average of a larger volume of water is recommended Using the M1 M2 M3 Or M4 Commands will acquire an average of 30 60 120 or 300 seconds The LISST ABS will remain powered between...

Page 14: ...the datalogger The mating connector makes it easy to remove the long cable without disconnecting the wires from the datalogger You can also easily switch between the datalogger and the USB cable if n...

Page 15: ...mand Code Notes Display Status DS Status Display the Current Status of the instrument including instrument serial number and firmware version Take and Transmit Sample and hold GS GetSample Instrument...

Page 16: ...kes a measurement stores it in memory and outputs the averaged Uncalibrated Concentration value to the RS 232 output Example Command GS 30 Response delay of 30 seconds 1 23456E3 LISST ABS Command GS R...

Page 17: ...mand Exit Response delay of 1 second 1 23456E3 delay of 1 second 1 23456E3 Help Display Help Syntax HE or help Description Displays a list of commands available with brief descriptions Example Command...

Page 18: ...ecorded and averaged to obtain the best results Because of the small measurement volume of the LISST ABS the ACB measurements can be vary sample to sample as clouds of turbidity pass by In order to ob...

Page 19: ...ination with only the four individual wires that are labeled and can be easily connected to the datalogger The mating connector makes it easy to remove the long cable without disconnecting the wires f...

Page 20: ...ng a running average of attenuation that is used internally to compute the concentration value Shorter waits will result in noisier measurements It is also recommended that bursts of 30 measurements o...

Page 21: ...this message return to the USB card and run the dotNetFx40_Client exe installer This will install the NET framework on your computer Once that is completed relaunch the LISST ABS_installer exe and fo...

Page 22: ...the software will find the instrument and begin displaying concentration values default calibration factor of 1 The instrument serial number will also be displayed at the bottom left of the screen Th...

Page 23: ...several instances of the LISST ABS program to view data from multiple instruments Sampling Parameters Just below the concentration plot you have the ability to adjust the number of measurements to ave...

Page 24: ...appear It will list the steps you need to follow to calibrate the instrument left A check box at the bottom of the window allows you to save a calibration text file that contains the 100 uncalibrated...

Page 25: ...rting the calibration It will contain a header with calibration information followed by the 100 uncalibrated ABS measurements used to calculate the new calibration factor Should you need to remind you...

Page 26: ...shown just below the concentration plot The log file header contains calibration information the computers current time zone and the instrument serial number The header is followed by three columns o...

Page 27: ...e Clear Plot button This will only clear the display and will have no effect on data logging or calibration If the software is left to run for a long period of time the plot will show a maximum of 900...

Page 28: ...logging data the logging will pause and resume automatically when the instrument is reconnected Should one of the two error codes be produced by the ABS a brief description of the problem will be sho...

Page 29: ...s The terminal window allows you communicate directly with the instrument This can be useful for retriving information about your sensor or exploring the instruments serial communication features Text...

Page 30: ...e the automatic port searching feature If you know what port your LISST ABS is connected to you can specify the port in this window This can be useful if you are on a computer with many ports or have...

Page 31: ...ly To avoid interference from bottom reflection the sensor head must be at least 15 cm above the hard bottom The computation of Uncalibrated Concentration assumes that the concentration is similar bet...

Page 32: ...t it can be connected to the dataloggers We will start at connector on the LISST ABS and work toward the end of the long cable The endcap connector on the LISST ABS is an Impulse MCBH8 M P wired as sh...

Page 33: ...a long cable RS232 pigtail SDI 12 pigtail Analog pigtail Pin Function Wire color Wire color Wire color Wire color Wire color 1 Common Black White Black Black Black 2 V 10 to 18V White Red Red Red Red...

Page 34: ...ew value for Cal Factor Recalibration can be done by using the provided Windows software You will need to prepare a known concentration of your suspension in a very well mixed chamber Insert the instr...

Page 35: ...d to the outgoing pressure pulse Po the geometric spreading G R and attenuation by the combination of water and sediments It is helpful now to consider the signal via the sonar equation log10 P Po G R...

Page 36: ...that near field effect has been considered Recalibration The relationship between ACB and sediment concentration is shown in the figure below for 5 10 micron AC dust Note that this is a log linear re...

Page 37: ...th in situ samples Mechanical and Electrical Sensor Dia 2 00 in 5 08 cm Length 13 25 in 33 65 cm Weight 1 lb 0 5 Kg in air 0 5 lb 0 22Kg buoyant in water Transducer 10mm dia ceramic External supply 10...

Page 38: ...t approved by SEQUOIA or the serial number on a product if applicable has been altered or defaced SEQUOIA shall not be liable for normal wear and tear such as replacement of consumables nor for defect...

Page 39: ...shall not use a Product or Products for such purposes if it is unwilling or unable to provide such indemnification 9 Statute of Limitations Customer will not commence any action based on breach of wa...

Page 40: ...n 1 0 Update analog output range specification and clarify section 2 4 Update maximum concentration specifications Minor editing clarifications Deleted GO command no longer supported Complete revision...

Reviews: