23
being calibrated, data are plotted in red.
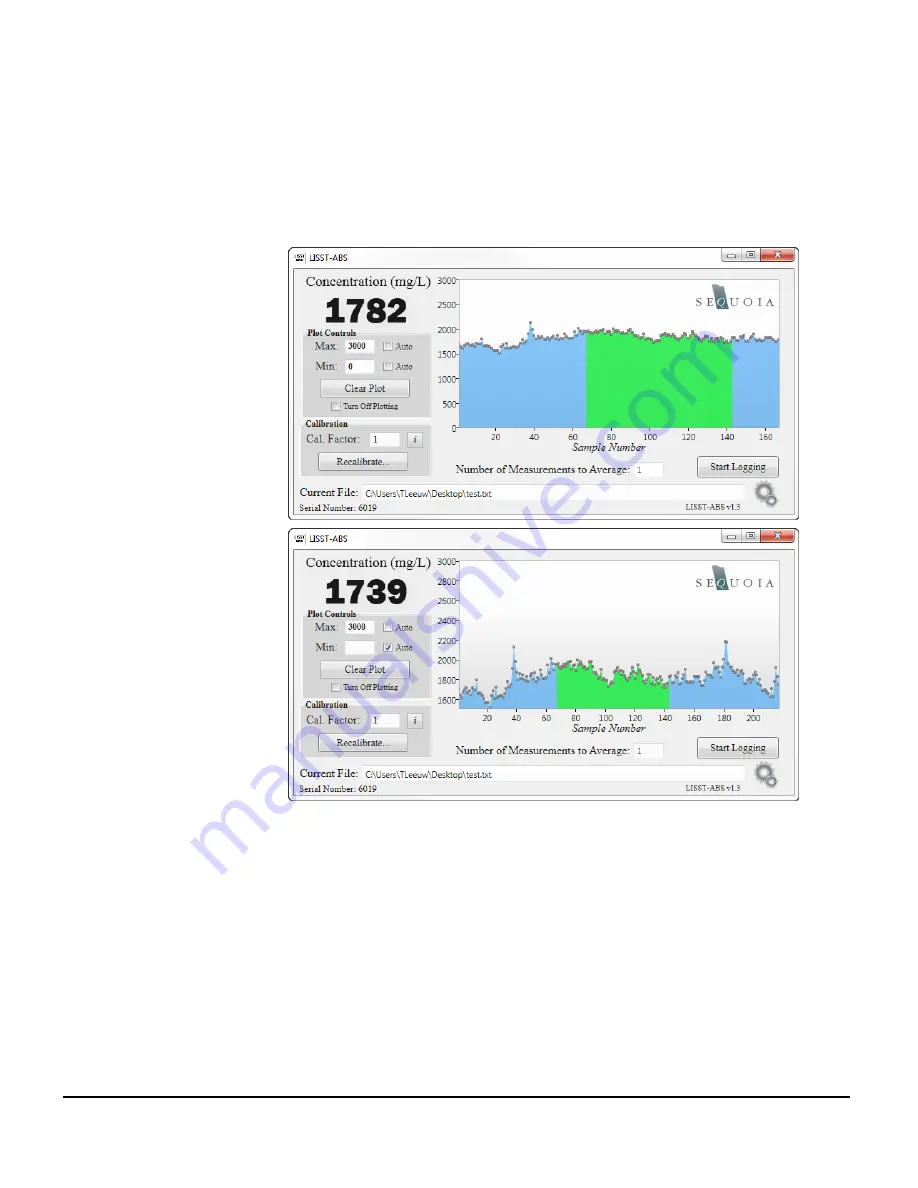
Scaling of the y-axis is handled automatically by default.
However, if you wish to lock the y-axis limits at a specific value,
enter
a number in the text box next to ‘Min’ or ‘Max’ in the ‘Plot
Controls’ box. You can switch back to auto scaling by checking
the ‘Auto’ checkbox.
The data currently in the plot can be cleared by pressing the
‘Clear Plot’ button. This will only clear the display and will have
no effect on data logging or calibration. If the software is left to
run for a long period of time, the plot will show a maximum of
900 data points (15 minutes at a measurement average of 1).
After 900 points, the x-axis will scroll, showing only the most
recent 900 points.
Plotting of data can
be disabled by checking the ‘Turn Off
Plotting’ checkbox. This is recommended if you will be leaving
the ABS unattended to log data for long periods of time. In
these cases there is no need to tie up computer resources
Summary of Contents for LISST-ABS
Page 2: ......


